College Algebra (MindTap Course List)
12th Edition
ISBN: 9781305652231
Author: R. David Gustafson, Jeff Hughes
Publisher: Cengage Learning
expand_more
expand_more
format_list_bulleted
Concept explainers
Question

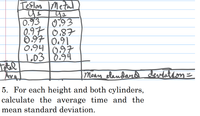
Transcribed Image Text:Teslon Metal
yo
0.93
0:93
0.9710,87
6.97 0.91
0.94 l097
T.03|0.94
837
Mean olandard devlation=
5. For each height and both cylinders,
calculate the average time and the
mean standard deviation.
Expert Solution
arrow_forward
Step 1
Given information and calculation is shown below
Step by stepSolved in 2 steps with 1 images

Knowledge Booster
Learn more about
Need a deep-dive on the concept behind this application? Look no further. Learn more about this topic, statistics and related others by exploring similar questions and additional content below.Similar questions
- Find the mean hourly cost when the cell phone described above is used for 240 minutes.arrow_forwardplease solve within 30 minjtes.arrow_forwardA B D E Square footage Lower Limit Upper Limit 1 Frequency 5 2 0-499 499 3 500-999 500 999 17 4 1000-1499 1000 1499 33 5 1500-1999 6 2000-2499 7 2500-2999 8 3000-3499 9 3500-3999 1500 1999 121 2000 2499 119 2500 2999 83 3499 3000 3500 45 3999 41 10 4000-4499 4000 4499 26 11 4500-4999 4500 4999 10 12 13 14 15 16arrow_forward
- Suppose the average life of kiwi phones is 4.66 years with standard deviation 1.05 years. Let X represent the average lif of 40 r/s kiwi phones. Find P( x > 5)arrow_forwardPlz all will ratearrow_forwardApproximate the population mean and standard deviation of age for females. By the way, we find the midpoints by adding the first numbers before the hyphens in the age column and then dividing by 2 (ex: 0+10/2=5, 10+20/2=15, 20+30/2=25).arrow_forward
- In the past, the mean age of students at a summer camp was 16.9 years old. A recent sample of 16 students from the camp found x = 13.4, s = 2.3. a. Build a 80% CI for the current mean age of students at the camp. Round all intermediate calculations to two decimals, then construct the Cl and enter like this: (min,max). Note: if you use a built-in Cl command on a calculator/computer, you might get marked wrong due to rounding. Use the formulas given in the text/notes. b. Use your CI to decide whether the mean age of students at the camp has changed from 16.9 years old. O Yes, the mean has probably changed since the old value of u is not right in the middle of the new CI No, the mean has not changed since the old value of u is right in the middle of the new O No, the mean has probably not changed since the new Cl contains the old value of u O Yes, the mean has probably changed since the new CI does not contain the old value of u c. For this problem, it is important that we know that ages…arrow_forwardWhich of the measurements of variation computed in parts a-c have the same units of measure (number of sword shafts) as the original variable?arrow_forwardThe torque, T(N.m), required to rotate shafts of different diameters, D(mm), on a machine is shown in the table below. If the low is: T = aD" where a and n are constants. Determine the constants a and n to give the best fit to following data: D (тm) | 7.0 T (N.m) 0.974 Then standard deviation (S,) about the mean. 10 1.71 25 18 4.33 40 15.3 7.28arrow_forward
- Determine the standard deviation of the densities: x1 = 2.85 g/ml, x2 = 2.67 g/ml, x3 = 2.63 g/ml a. none of these b. 0 g/ml c. 0.1172 g/ml d. 0.117 g/ml e. 0.117189 g/ml f. 0.1 g/ml g. 0.12 g/ml h. 0.11 g/mlarrow_forwardA large automobile insurance company selected samples of single and married male policyholders and recorded the number who made an insurance claim over the preceding three-year period. Single Policyholders Married Policyholders ni = 412 n2 = 778 Number making claims = 75 Number making claims = 111 a. Use a= 0.05. Test to determine whether the claim rates differ between single and married male policyholders. z-value (to 2 decimals) p-value (to 4 decimals) We cannot conclude that there is the difference between claim rates. b. Provide a 95% confidence interval (to 4 decimals) for the difference between the proportions for the two populations. Enter negative answer as negative number.arrow_forwardFluorescent lightbulbs have lifetimes that are normally distributed with a mean of 6.2 years and a standard deviation of 1 year. The figure below shows the distribution of lifetimes of fluorescent lightbulbs. Calculate the shaded area under the curve.Express your answer in the decimal form accurately to at least two decimal places. Answer:arrow_forward
arrow_back_ios
SEE MORE QUESTIONS
arrow_forward_ios
Recommended textbooks for you
 College Algebra (MindTap Course List)AlgebraISBN:9781305652231Author:R. David Gustafson, Jeff HughesPublisher:Cengage Learning
 Glencoe Algebra 1, Student Edition, 9780079039897...AlgebraISBN:9780079039897Author:CarterPublisher:McGraw Hill
 Algebra: Structure And Method, Book 1AlgebraISBN:9780395977224Author:Richard G. Brown, Mary P. Dolciani, Robert H. Sorgenfrey, William L. ColePublisher:McDougal Littell
 Big Ideas Math A Bridge To Success Algebra 1: Stu...AlgebraISBN:9781680331141Author:HOUGHTON MIFFLIN HARCOURTPublisher:Houghton Mifflin Harcourt

College Algebra (MindTap Course List)
Algebra
ISBN:9781305652231
Author:R. David Gustafson, Jeff Hughes
Publisher:Cengage Learning

Glencoe Algebra 1, Student Edition, 9780079039897...
Algebra
ISBN:9780079039897
Author:Carter
Publisher:McGraw Hill

Algebra: Structure And Method, Book 1
Algebra
ISBN:9780395977224
Author:Richard G. Brown, Mary P. Dolciani, Robert H. Sorgenfrey, William L. Cole
Publisher:McDougal Littell

Big Ideas Math A Bridge To Success Algebra 1: Stu...
Algebra
ISBN:9781680331141
Author:HOUGHTON MIFFLIN HARCOURT
Publisher:Houghton Mifflin Harcourt