
MATLAB: An Introduction with Applications
6th Edition
ISBN: 9781119256830
Author: Amos Gilat
Publisher: John Wiley & Sons Inc
expand_more
expand_more
format_list_bulleted
Related questions
Question
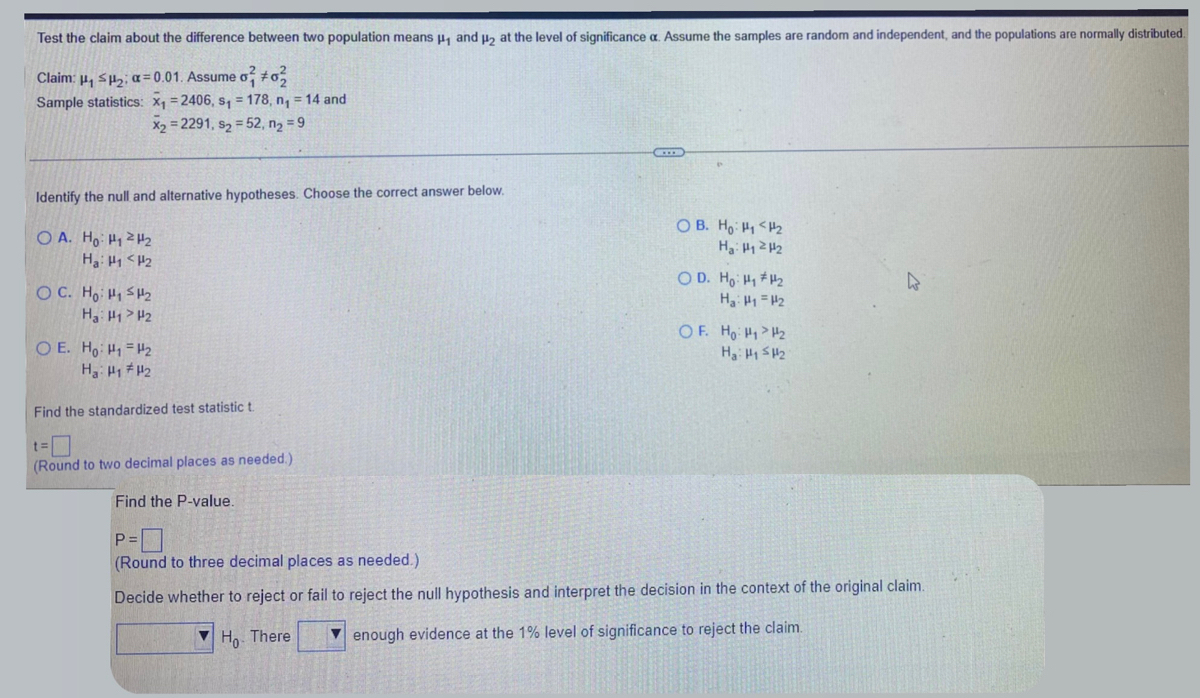

Transcribed Image Text:Test the claim about the difference between two population means ₁ and ₂ at the level of significance a. Assume the samples are random and independent, and the populations are normally distributed.
Claim: ₁₂; a=0.01. Assume o #02
Sample statistics: x₁=2406, s₁ = 178, n₁ = 14 and
X₂=2291, s₂=52, n₂ = 9
Identify the null and alternative hypotheses. Choose the correct answer below.
OA. Ho: H₁ H₂
Ha: H1 H2
OC. Ho: H₁
H₂
Ha: H1 H2
OE. Ho: H₁ H₂
Ha: H1 H2
Find the standardized test statistic t
t=
(Round to two decimal places as needed.).
OB. Ho: H₁ H₂
Ha: H₁ 24₂
OD. Ho: ₁₂
Ha: H1 H₂
OF. Ho: H₁ H₂
H₂: H₁ H₂
Find the P-value.
P=0
(Round to three decimal places as needed.).
Decide whether to reject or fail to reject the null hypothesis and interpret the decision in the context of the original claim.
▼ Ho There
enough evidence at the 1% level of significance to reject the claim.
Expert Solution
This question has been solved!
Explore an expertly crafted, step-by-step solution for a thorough understanding of key concepts.

Step by stepSolved in 3 steps with 9 images

Knowledge Booster

Similar questions
- Aurora is conducting a one-sample ?z test of the null hypothesis ?0:?=0.12H0:p=0.12 against the alternative ??:?<0.12Ha:p<0.12, where ?p is the population proportion. She requires her results to be statistically significant at a level of ?=0.10α=0.10. She selects a random sample of size ?n = 200 and calculates the sample proportion, ?̂ p^ = 0.10. What is the value of the standardized test statistic and ?P-value of her test? Give ?z precise to two decimal places and the ?P-value precise to four decimal places.arrow_forwardTest the claim about the population mean, µ, at the given level of significance using the given sample statistics. Claim: µ= 50; a = 0.04; o = 3.91. Sample statistics: x= 49.2, n = 77 %3D Identify the null and alternative hypotheses. Choose the correct answer below. Ο Α. H : μ 50 В. Но: н#50 %3D Ha: H> 50 Ha: H= 50 C. H : μ 50 HaiH 50 Ha: µ= 5 Calculate the standardized test statistic. The standardized test statistic is (Round to two decimal places as needed.)arrow_forwardGiven the two independent samples below, conduct a hypothesis test for the desired scenario. Assume all populations are approximately normally distributed. Sample 1 Sample 2 n1= 953 n2= 880 x¯1= 381 x¯2= 456 s1= 156 s2= 170 Test the claim: Given the null and alternative hypotheses below, conduct a hypothesis test for α=0.05.H0: μ1=μ2Ha: μ1≠μ2 Given the alternative hypothesis, the test is Determine the test statistic. Round to four decimal places.t= Find the pp-value. Round to 4 decimals.p-value = Make a decision. Fail to reject the null hypothesis. Reject the null hypothesis.arrow_forward
- Test the claim about the population mean, μ, at the given level of significance using the given sample statistics. Claim: μ=40; α=0.07; σ=3.78. Sample statistics: x=38.2, n=53 Identify the null and alternative hypotheses. Choose the correct answer below. A. H0: μ<40 Ha: μ=40 B. H0: μ=40 Ha: μ≠40 C. H0: μ=40 Ha: μ>40 D. H0: μ>40 Ha: μ=40 E. H0: μ≠40 Ha: μ=40 F. H0: μ=40 Ha: μ<arrow_forwardUse a t-test to test the claim about the population mean u at the given level of significance a using the given sample statistics. Assume the population is normally distributed. Claim: µ = 52,500; a = 0.05 Sample statistics: x= 53,637, s= 2400, n = 18 Click the icon to view the t-distribution table. What are the null and alternative hypotheses? Choose the correct answer below. Ο Α. Hρ μ= 52,500 Hai µ#52,500 B. Ho: µ+ 52,500 Hai µ = 52,500 O C. H μ 52,500 Ha: µ 52,500 What is the value of the standardized test statistic? The standardized test statistic is |. (Round to two decimal places as needed.) What is(are) the critical value(s)? The critical value(s) is(are) (Round to three decimal places as needed. Use a comma to separate answers as needed.) Decide whether to reject or fail to reject the null hypothesis. O A. Reject Ho. There is enough evidence to reject the claim. O B. Fail to reject Ho. There is enough evidence to reject the claim. Click to select your answer(s).arrow_forwardTest the claim about the population mean, μ,at the given level of significance using the given sample statistics. Claim: μ=30 α=0.06 σ=3.64 Sample statistics: x=28.8, n=80arrow_forward
- Test the claim about the population mean, μ, at the given level of significance using the given sample statistics. Claim: μ=50; α=0.09; σ=3.33. Sample statistics: x=48.2, n=67 Identify the null and alternative hypotheses. Choose the correct answer below. A. H0: μ=50 Ha: μ≠50 Your answer is correct. B. H0: μ=50 Ha: μ<50 C. H0: μ≠50 Ha: μ=50 D. H0: μ>50 Ha: μ=50 E. H0: μ=50 Ha: μ>50 F. H0: μ<50 Ha: μ=50 Calculate the standardized test statistic. The standardized test statistic is enter your response here. (Round to two decimal places as needed.)arrow_forwardTest the claim about the population mean, μ,at the given level of significance using the given sample statistics. Claim: μ=50; α=0.08; σ=3.95. Sample statistics: x=49.7, n=67 a. Identify the null and alternative hypotheses b. Calculate the standardized test statistic. c. Determine the critical value(s). d. Determine the outcome and conclusion of the test.arrow_forwardTest the claim about the population mean,μ,at the given level of significance using the given sample statistics. Claim: μ≠6000 α=0.07 σ=330 Sample statistics: x=5600 n=32arrow_forward
- Test the claim about the population mean, μ, at the given level of significance using the given sample statistics. Claim: μ≠6000; α=0.08; σ=391. Sample statistics: x=5900, n=49 Determine the outcome and conclusion of the test. Choose from the following. A. Reject H0. At the 8% significance level, there is enough evidence to support the claim. B. Fail to reject H0. At the 8% significance level, there is not enough evidence to support the claim. C. Fail to reject H0. At the 8% significance level, there is not enough evidence to reject the claim. D. Reject H0. At the 8% significance level, there is enough evidence to reject the claim.arrow_forwardTest the claim about the difference between two population means µ₁ and µ₂ at the level of significance a. Assume the samples are random and independent, and the populations are normally distributed. Claim: μ₁ μ₂; α=0.10. Assume o² #02 Sample statistics: x₁=2404, s₁ = 177, n₁ = 15 and x₂ = 2299, s₂ = 54, n₂ = 10 Identify the null and alternative hypotheses. Choose the correct answer below. A. Ho: ₁ = ₂ Hai Mi#H2 C. Ho: H₁ H₂ Hai HSM2 E. Ho: H₁ H₂ Ha: ₁ = ₂ Find the standardized test statistic t. t= (Round to two decimal places as needed.) Find the P-value. P= (Round to three decimal places as needed.) Decide whether to reject or fail to reject the null hypothesis and interpret the decision in the context of the original claim. Ho. There enough evidence at the 10% level of significance to reject the claim. B. Ho: H₁ H₂ Ha: ₁ H2arrow_forwardTest the claim about the difference between two population means u, and H2 at the level of significance a. Assume the samples are random and independent, and the populations are normally distributed. Claim: u, = H2; a=0.10. Assume o? =o? Sample statistics: x1 = 33.1, s, = 3.5, n, = 14 and X2 = 35.8, s2 = 2.2, n2 = 19 Identify the null and alternative hypotheses. Choose the correct answer below. O A. Ho: H12 H2 O B. Ho: H1 H H: H1 H2 O C. Ho: H1 Hz Ha: H1 SH2 Find the standardized test statistic t. (Round to two decimal places as needed.) Find the P-value. P= (Round to three decimal places as needed.) Decide whether to reject or fail to reject the null hypothesis and interpret the decision in the context of the original claim. O Time Remainingarrow_forward
arrow_back_ios
SEE MORE QUESTIONS
arrow_forward_ios
Recommended textbooks for you
- MATLAB: An Introduction with ApplicationsStatisticsISBN:9781119256830Author:Amos GilatPublisher:John Wiley & Sons Inc
 Probability and Statistics for Engineering and th...StatisticsISBN:9781305251809Author:Jay L. DevorePublisher:Cengage Learning
 Statistics for The Behavioral Sciences (MindTap C...StatisticsISBN:9781305504912Author:Frederick J Gravetter, Larry B. WallnauPublisher:Cengage Learning
  Elementary Statistics: Picturing the World (7th E...StatisticsISBN:9780134683416Author:Ron Larson, Betsy FarberPublisher:PEARSON
 The Basic Practice of StatisticsStatisticsISBN:9781319042578Author:David S. Moore, William I. Notz, Michael A. FlignerPublisher:W. H. Freeman
 Introduction to the Practice of StatisticsStatisticsISBN:9781319013387Author:David S. Moore, George P. McCabe, Bruce A. CraigPublisher:W. H. Freeman
MATLAB: An Introduction with Applications
Statistics
ISBN:9781119256830
Author:Amos Gilat
Publisher:John Wiley & Sons Inc
Probability and Statistics for Engineering and th...
Statistics
ISBN:9781305251809
Author:Jay L. Devore
Publisher:Cengage Learning
Statistics for The Behavioral Sciences (MindTap C...
Statistics
ISBN:9781305504912
Author:Frederick J Gravetter, Larry B. Wallnau
Publisher:Cengage Learning
Elementary Statistics: Picturing the World (7th E...
Statistics
ISBN:9780134683416
Author:Ron Larson, Betsy Farber
Publisher:PEARSON
The Basic Practice of Statistics
Statistics
ISBN:9781319042578
Author:David S. Moore, William I. Notz, Michael A. Fligner
Publisher:W. H. Freeman
Introduction to the Practice of Statistics
Statistics
ISBN:9781319013387
Author:David S. Moore, George P. McCabe, Bruce A. Craig
Publisher:W. H. Freeman