
MATLAB: An Introduction with Applications
6th Edition
ISBN: 9781119256830
Author: Amos Gilat
Publisher: John Wiley & Sons Inc
expand_more
expand_more
format_list_bulleted
Related questions
Question
Solve the following proportion hypothesis:
Give: Ho: p ≤ 0.6
H1: p > 0.6
A binomial distribution can be approximated with thenormal distribution , so use a
z-score for α=0.05.
Test the above hypothesis is a random sample of 250 users has 210 successes.
Solution: [Write rules/formula]
Calculate p̄ :
Calculate Zp :
Find Zα :
Compare Zp and Zα :
Conclusion:
-Suppose we fail to reject Ho: μ ≥ 50 When the true mean is μ = 53
Given a sample of size n=64 and σ =6 and with α=0.05
Calculate the critical sample mean Xα , the ZX̅α , The probability of type II error β
and the power of the hypothesis test P.
Solution: [Write the rules/formula]
Calculate X̅α :
Calculate ZX̅α with the true mean μ = 53:
The probability of type II error β:
The power of the hypothesis test P:
Give: Ho: p ≤ 0.6
H1: p > 0.6
A binomial distribution can be approximated with the
z-score for α=0.05.
Test the above hypothesis is a random sample of 250 users has 210 successes.
Solution: [Write rules/formula]
Calculate p̄ :
Calculate Zp :
Find Zα :
Compare Zp and Zα :
Conclusion:
-Suppose we fail to reject Ho: μ ≥ 50 When the true mean is μ = 53
Given a sample of size n=64 and σ =6 and with α=0.05
Calculate the critical sample mean Xα , the ZX̅α , The probability of type II error β
and the power of the hypothesis test P.
Solution: [Write the rules/formula]
Calculate X̅α :
Calculate ZX̅α with the true mean μ = 53:
The probability of type II error β:
The power of the hypothesis test P:
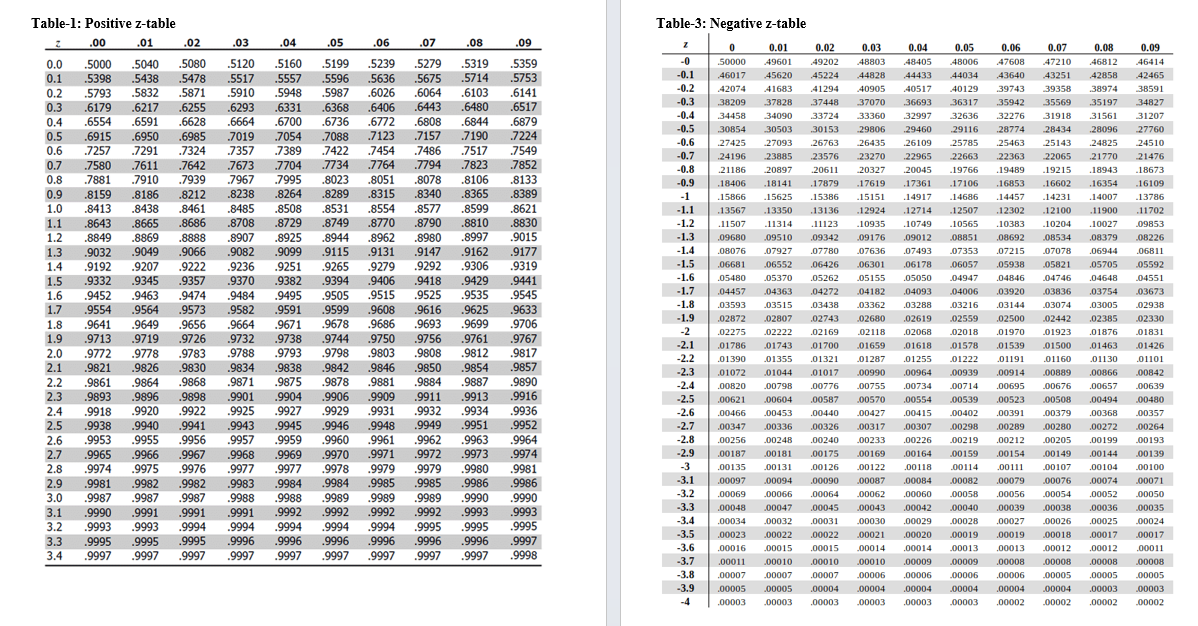

Transcribed Image Text:Table-1: Positive z-table
NNNNNNNNNNŇ Š Š Š Šm
2345678901234
8849 8869
7734 7764
9505 9515
9931 9932
9961
9854
Table-3: Negative z-table
00010
00007
00005
.00003
34090 33724
23576 23270
20611 20327
17879 17619
15625 15300
00002
00240 .00233
00175 00169
00120 NOT
00064 00062
00045
00043
.00032
.00031 .00030
.00022
.00022 00021
00015 .00015 .00014
00007
00003 .00003
00006
00003
0.05
32636 32270
19766 19489
17106 16853
14457
14917 .14686
00006
00004
00003
131901
18943
.16354
.14007
.00025
.00017
00005
00003
.00002
00003
00002

Transcribed Image Text:Table-5: t-Table One Tale
DF
00
2
3
........
4
5
6
7
8
9
10
11
12
13
14
15
16
17
18
19
20
21
22
23
* * * * * * * * * *
1000
A = 0.1
ta - 1.282
3.078
1.886
1.638
1.533
1.476
1-44
1.415
1.397
1.383
1.372
Baye
1.363
1.303
1.356
1.35
1.345
Tom
1.341
comm
1.337
1.333
1.33
1.328
1.325
1.323
1.321
1.319
1.318
1.316
1.315
1.314
1.313
1.311
1.31
1.296
1.289
1.282
0.05
1.645
6.314
2.92
2.353
2.132
2.015
1.943
1.895
1.86
1.833
1.812
1.796
1.782
1.771
1.761
1.753
1016
1.746
1.74
1.734
1.729
1.725
P
1.721
1.717
B
1714
1.711
com
1.708
1.706
1.703
1.701
1.699
1.697
1.671
1.658
1.646
0.025
1.96
12.706
4.303
3.182
2.776
B
2.571
2.447
2.365
2.306
2.262
2.228
2.201
2:201
2.179
2.16
2.145
2.131
0.10
2.12
2.11
2.101
2.093
2.086
2.08
2.074
2.069
2.064
0.06
2.06
2.056
2.052
2.048
2.045
2.042
2
1.98
1.962
0.01
2.326
31.821
6.965
4-541
3-747
3.365
3.143
2.998
2,896
2.821
2.764
2:709
2.718
2:718
2.681
2.65
2.624
2.602
2.583
2.567
2.552
2.539
2.528
2.518
2.508
2.5
2.492
2.485
2.479
2.473
2.467
2.462
2-457
2.39
2.358
2.33
0.005
2.576
63.656
9.925
5.841
4.604
4.032
3.707
3-499
3-355
3.25
3.169
3.106
3.100
3.055
3.012
2.om
2.977
2.947
2.921
...
2.898
..
2.878
2.861
2.845
2.831
2.819
2.807
2.797
2.787
2.779
2.771
2.763
2.756
2.75
2.66
2.617
2.581
0.001
3.091
318.289
22.328
10.214
7.173
5.894
5.208
4-785
4-501
4.297
4.144
40094
4.025
4:025
3.93
3.852
9787
3-787
3.733
3.686
3.646
261
3.61
3-579
3-552
3-527
3-505
3-485
3.467
3-45
3-435
3-421
3.408
3.396
3.385
3.232
3.16
3.098
0.0005
3.291
636.578
31.6
12.924
8.61
6.869
5-959
5-408
5.041
4.781
4-587
4-437
4-437
4-318
4:221
.....
4-14
4.073
com
4.015
3.965
3.922
3.883
3.85
3.819
3-792
3.768
3.745
..
3.725
3.707
3.689
3.674
3.66
3.646
3-46
3-373
3-3
Table-5: t-Table Two Tail
DF
2
3
4
5
6
7
8
9
10
11
12
13
14
15
16
17
18
19
20
21
22
23
24
25
26
27
28
29
30
60
120
8
A = 0.2
ta - 1.282
3.078
1.886
1.638
1.533
1.476
1.415
1.397
1.383
1.372
1.363
1.356
1.35
1.345
1.341
1:341
1.337
1.333
100
1.33
1008
1.328
Loor
1.325
1.323
1.321
1.319
1.318
1.316
1.215
1.315
101
1.314
1.313
1.311
1.31
1.296
1.289
1.282
0.1
1.645
6.314
2.92
2.259
2-353
2 192
2.132
2.015
1.943
1.895
1.86
1.833
1.812
1.796
1.782
1.771
1.761
1.753
1:753
1.746
1.74
1724
1.734
1.729
1.725
...
1.721
1.717
1.714
1.711
1.708
1.706
1709
1.703
1.701
1.699
1.697
1.671
1.658
1.645
0.05
1.96
t
12.706
4.303
3.182
2.776
2.571
2.447
2.365
2.306
2.262
2.228
2.201
2.179
2.16
2.145
B
2.131
ange
2.12
2.11
2:11
2.101
2.093
2.086
2.00
2.08
2.074
2.069
2.064
2.06
2.056
2052
2.052
2018
2.048
2.045
2.042
2
1.98
1.96
0.02
2.326
31.821
6.965
4-541
3-747
3.365
3.143
2.998
2.896
2.821
2.764
2.718
2.681
2.65
2.624
2.602
2.583
2.567
2.552
2.539
2.528
2.518
2.508
2.5
2.492
2.485
2.470
2-479
2.473
2.467
2.462
2-457
2.39
2.358
2.326
0.01
2.576
63.656
9.925
5.841
+601
4.604
4.032
3.707
Ba
3-499
3.355
3.25
3.169
3.106
3.055
3.012
2.977
com
2.947
2.921
2.898
2.878
2.861
08.
2.845
2.831
2.819
2.807
2.797
2.787
200
2.779
Am
2.771
anta
2.763
2.756
2.75
2.66
2.617
2.576
0.002
3.091
318.289
22.328
10.214
7.173
5.894
....
M
5.208
4-785
4-501
4.297
4.144
4.025
3.93
3.852
3-787
syy
3.733
3.686
3.646
3.61
3-579
3-552
3-527
3-505
3.485
3.467
3.45
3.45
2.425
3-435
0401
3-421
3-408
3.396
3.385
3.232
3.16
3.091
0.001
3.291
636.578
31.6
12.924
8.61
6060
6.869
..com
5.959
5-408
5.041
B
4.781
4-587
4-437
4-318
4.221
4-14
4.073
4.015
3.965
3.922
3.883
a sc
3.85
0 810
3.819
3-792
3.768
3.745
3.725
3-707
2 680
3.689
3.674
2.66
3.66
3.646
3-46
3-373
3.291
Expert Solution
This question has been solved!
Explore an expertly crafted, step-by-step solution for a thorough understanding of key concepts.

Step by stepSolved in 3 steps

Knowledge Booster

Similar questions
- I need help finding the mean for part D, I tried 1.510 and got it wrong and I also tried 1.496 and I also got that wrong.arrow_forwardis being approxin Let X1,..., Xn be an iid with mean, µ = E(X), and variance, o2 = Var(X). True or False, and briefly explain: The sample average, X, can be expected to be closer and closer to µ as n gets bigger and pigger. Confidence Intervalsarrow_forwardweight is recorded in grams. Linda feeds her rats Formula A, Tuan feeds his rats Formula B, and Javier feeds his rats Formula C. At the end of a specified time period, each rat is weighed again, and the net gain in grams is recorded. Using a significance level of 0.05, test the hypothesis that the three formulas produce the same mean weight gain.H0: μ1 = μ2 = μ3Ha: At least two of the means differ from each other Forumla A Forumla B Forumla C 51 39.4 53.6 55.8 55.1 42.4 53.8 33.1 50.1 43.2 58.7 40.4 42.1 40.4 46.9 50.1 19 45.6 59.5 43.2 48.7 35.4 32.2 49.5 45.2 16.4 56.1 Run a one-factor ANOVA with α=0.05. Report the F-ratio to 4 decimal places and the p-value to 4 decimal places.F = p-value = Based on the p-value, what is the conclusion Reject the null hypothesis: at least one of the group means is different Fail to reject the null hypothesis: not sufficient evidence to suggest the group means are differentarrow_forward
- At an art store, the mean sale amount is $1250 per customer. The owner thinks that the mean sales amount increases during promotion. A random sample of 45 paintings purchased during a promotion was selected, the sample mean sales amount is x¯=1315. Assume σ=$155. How can I implement the hypothesis test to check if the mean sales amount increases during promotion, and let α=0.01. I want to solve by both P-value method and reject region method.arrow_forwardProvide an appropriate response. Suppose you want to test the claim thatu, < µz. Two samples are randomly selected from each population. The sample statistics are given below. At a level of significance of a = 0.05, when should you reject Ho? One Left Tail Test-Z table n1 = 35 n2 = 42 X1 = 29.23 X2 = 31.78 S1 = 2.9 s2 = 2.8 Reject Ho if the standardized test statistic is less than -1.645. Reject Ho if the standardized test statistic is less than -2.33. O Reject Ho if the standardized test statistic is less than -2.575. Reject Ho if the standardized test statistic is less than -1.96.arrow_forwardA psychologist would like to know whether the 4 seasons have any consistent effect on Amazon shopping. In the middle of each season, a psychologist selects a random sample of n=23n=23 students. Complete the following, ANOVA summary table (α=0.10α=0.10). Round values for SS and MS to 3 decimal places as needed. Round p-value to 4 decimal places. Source SS df MS F P Between 1.339 Within 1090.32 TOTALarrow_forward
- Life on Other Planets Forty-five percent of people believe that there is life on other planets in the universe. A scientist does not agree with this finding. He surveyed 110 randomly selected individuals and found 66 believed that there is life on other planets. At α=0.05, is there sufficient evidence to conclude that the percentage differs from 45? Use the P-value method with a graphing calculator. State the hypotheses and identify the claim with the correct hypothesis. H0 : p=0.45 ▼not claim H1 : p≠0.45 ▼claim This hypothesis test is a ▼two-tailed test. Find the P-value. Round the answer to four decimal places. P-value = ___________________arrow_forwardPlz help asap 46arrow_forwardstate whether or not this resulting observed interval ended up capturing the true population proportion p of 0.45.arrow_forward
- 17arrow_forwardUsing the first image's question, answer all the questions asked in second image.arrow_forwardAt a carpet store, the mean sale amount is $1250 per customer. It is believed that the mean sales amount increases during promotion. A random sample of 45 carpet purchases during a promotion was selected, sample mean sales amount is = 1315. Assume o = $155. Implement hypothesis test to check if mean sales amount increases during promotion, and let a = 0.01. Require to solve by both P-value method and reject region method.arrow_forward
arrow_back_ios
SEE MORE QUESTIONS
arrow_forward_ios
Recommended textbooks for you
- MATLAB: An Introduction with ApplicationsStatisticsISBN:9781119256830Author:Amos GilatPublisher:John Wiley & Sons Inc
 Probability and Statistics for Engineering and th...StatisticsISBN:9781305251809Author:Jay L. DevorePublisher:Cengage Learning
 Statistics for The Behavioral Sciences (MindTap C...StatisticsISBN:9781305504912Author:Frederick J Gravetter, Larry B. WallnauPublisher:Cengage Learning
  Elementary Statistics: Picturing the World (7th E...StatisticsISBN:9780134683416Author:Ron Larson, Betsy FarberPublisher:PEARSON
 The Basic Practice of StatisticsStatisticsISBN:9781319042578Author:David S. Moore, William I. Notz, Michael A. FlignerPublisher:W. H. Freeman
 Introduction to the Practice of StatisticsStatisticsISBN:9781319013387Author:David S. Moore, George P. McCabe, Bruce A. CraigPublisher:W. H. Freeman
MATLAB: An Introduction with Applications
Statistics
ISBN:9781119256830
Author:Amos Gilat
Publisher:John Wiley & Sons Inc
Probability and Statistics for Engineering and th...
Statistics
ISBN:9781305251809
Author:Jay L. Devore
Publisher:Cengage Learning
Statistics for The Behavioral Sciences (MindTap C...
Statistics
ISBN:9781305504912
Author:Frederick J Gravetter, Larry B. Wallnau
Publisher:Cengage Learning
Elementary Statistics: Picturing the World (7th E...
Statistics
ISBN:9780134683416
Author:Ron Larson, Betsy Farber
Publisher:PEARSON
The Basic Practice of Statistics
Statistics
ISBN:9781319042578
Author:David S. Moore, William I. Notz, Michael A. Fligner
Publisher:W. H. Freeman
Introduction to the Practice of Statistics
Statistics
ISBN:9781319013387
Author:David S. Moore, George P. McCabe, Bruce A. Craig
Publisher:W. H. Freeman