MATLAB: An Introduction with Applications
6th Edition
ISBN: 9781119256830
Author: Amos Gilat
Publisher: John Wiley & Sons Inc
expand_more
expand_more
format_list_bulleted
Question
Using the first image's question, answer all the questions asked in second image.

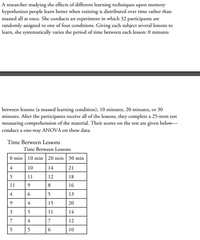
Transcribed Image Text:A researcher studying the effects of different learning techniques upon memory
hypothesizes people learn better when training is distributed over time rather than
massed all at once. She conducts an experiment in which 32 participants are
randomly assigned to one of four conditions. Giving each subject several lessons to
learn, she systematically varies the period of time between each lesson: 0 minutes
between lessons (a massed learning condition), 10 minutes, 20 minutes, or 30
minutes. After the participants receive all of the lessons, they complete a 25-item test
measuring comprehension of the material. Their scores on the test are given below-
conduct a one-way ANOVA on these data.
Time Between Lessons
Time Between Lessons
O min 10 min 20 min 30 min
4
10
14
21
5
11
12
18
11
9
8
16
5
13
9
4
15
20
3
5
11
14
4
7
12
5
10

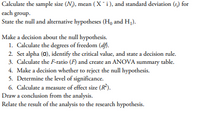
Transcribed Image Text:Calculate the sample size (N), mean (Xi), and standard deviation (s) for
each group.
State the null and alternative hypotheses (Ho and H;).
Make a decision about the null hypothesis.
1. Calculate the degrees of freedom (df.
2. Set alpha (0), identify the critical value, and state a decision rule.
3. Calculate the F-ratio (F) and create an ANOVA summary table.
4. Make a decision whether to reject the null hypothesis.
5. Determine the level of significance.
6. Calculate a measure of effect size (R).
Draw a conclusion from the analysis.
Relate the result of the analysis to the rescarch hypothesis.
Expert Solution
This question has been solved!
Explore an expertly crafted, step-by-step solution for a thorough understanding of key concepts.
Step by stepSolved in 4 steps

Knowledge Booster
Learn more about
Need a deep-dive on the concept behind this application? Look no further. Learn more about this topic, statistics and related others by exploring similar questions and additional content below.Similar questions
- Can you make your diagram more clearer?arrow_forwardA boy moves 4 miles south. Then he turns 90 degrees to the left. He moves forward 6 miles. He turns 90 degrees to the left. He moves forward 4 miles. How far is he now than from his starting point? (A) 4 miles (B) 3 miles (C) 6 miles (D) 5 milesarrow_forwardWhat does the middle dot or point denote?arrow_forward
arrow_back_ios
arrow_forward_ios
Recommended textbooks for you
 MATLAB: An Introduction with ApplicationsStatisticsISBN:9781119256830Author:Amos GilatPublisher:John Wiley & Sons Inc
 Probability and Statistics for Engineering and th...StatisticsISBN:9781305251809Author:Jay L. DevorePublisher:Cengage Learning
 Statistics for The Behavioral Sciences (MindTap C...StatisticsISBN:9781305504912Author:Frederick J Gravetter, Larry B. WallnauPublisher:Cengage Learning
 Elementary Statistics: Picturing the World (7th E...StatisticsISBN:9780134683416Author:Ron Larson, Betsy FarberPublisher:PEARSON
 The Basic Practice of StatisticsStatisticsISBN:9781319042578Author:David S. Moore, William I. Notz, Michael A. FlignerPublisher:W. H. Freeman
 Introduction to the Practice of StatisticsStatisticsISBN:9781319013387Author:David S. Moore, George P. McCabe, Bruce A. CraigPublisher:W. H. Freeman

MATLAB: An Introduction with Applications
Statistics
ISBN:9781119256830
Author:Amos Gilat
Publisher:John Wiley & Sons Inc

Probability and Statistics for Engineering and th...
Statistics
ISBN:9781305251809
Author:Jay L. Devore
Publisher:Cengage Learning

Statistics for The Behavioral Sciences (MindTap C...
Statistics
ISBN:9781305504912
Author:Frederick J Gravetter, Larry B. Wallnau
Publisher:Cengage Learning

Elementary Statistics: Picturing the World (7th E...
Statistics
ISBN:9780134683416
Author:Ron Larson, Betsy Farber
Publisher:PEARSON

The Basic Practice of Statistics
Statistics
ISBN:9781319042578
Author:David S. Moore, William I. Notz, Michael A. Fligner
Publisher:W. H. Freeman

Introduction to the Practice of Statistics
Statistics
ISBN:9781319013387
Author:David S. Moore, George P. McCabe, Bruce A. Craig
Publisher:W. H. Freeman