MATLAB: An Introduction with Applications
6th Edition
ISBN: 9781119256830
Author: Amos Gilat
Publisher: John Wiley & Sons Inc
expand_more
expand_more
format_list_bulleted
Question
thumb_up100%

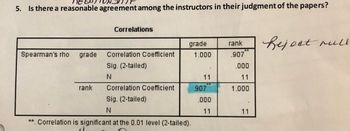
Transcribed Image Text:5. Is there a reasonable agreement among the instructors in their judgment of the papers?
Correlations
grade
rank
Reject rull
Spearman's rho grade
Correlation Coefficient
.907
Sig. (2-tailed)
N
rank
Correlation Coefficient
Sig. (2-tailed)
N
*. Correlation is significant at the 0.01 level (2-tailed).
1.000
11
.907
.000
11
.000
11
1.000
11
Expert Solution
This question has been solved!
Explore an expertly crafted, step-by-step solution for a thorough understanding of key concepts.
Step by stepSolved in 2 steps with 1 images

Knowledge Booster
Similar questions
- A study was done to look at the relationship between number of lovers college students have had in their lifetimes and their GPAs. The results of the survey are shown below. Lovers 8 3 1 3 6 3 4 8 GPA 2.1 2.7 3.2 2.6 2.8 3.1 2.9 2.2 Find the correlation coefficient: r=r= Round to 2 decimal places. The null and alternative hypotheses for correlation are:`H0: ` ? r ρ μ == 0`Ha:` ? r μ ρ ≠≠ 0 The p-value is: (Round to four decimal places) Use a level of significance of α=0.05α=0.05 to state the conclusion of the hypothesis test in the context of the study.arrow_forward13arrow_forwardInterpret the following output from a survey asking employees to indicate how many accidents they experienced at work (reported accidents), whether their supervisors enforce safety regulations (enforce), and how much their organization emphasized safety (safclim). Select all that apply. Correlations # Reported Accidents Pearson Correlation Sig. (2-tailed) N enforce Pearson Correlation Sig. (2-tailed) N safclim # Reported Accidents Pearson Correlation Sig. (2-tailed) N **. Correlation is significant at the 0.01 level (2-tailed). 1.000 123.000 .033 .716 121 -.064 .487 122 enforce .033 .716 121 1.000 safclim -.064 .487 122 .528** .000 126 1.000 126.000 .528** .000 126 127.000 This shows that there is a significant correlation between accidents at work and how much the organization emphasizes safety This shows that there is a positive correlation between the amount of supervisors enforce safety regulations and how much the organization emphasized safety There is a large effect size for…arrow_forward
- You are a researcher interested in crime and crime rates. You’ve collected a sample of data from the county level for your state. You hypothesize that the rate of violent crimes will be higher in counties with bigger populations. Based on the below Pearson correlation results, is your hypothesis supported or rejected?arrow_forwardCould you help me with this. With work if possiblearrow_forwardMatch the correlation strength on the left side with the correlation score on the right sidearrow_forward
- How well does your assessment of the top 10 party schools relate to the list identified by the Princeton Review? You rank each of the schools on their list and then calculate a statistic between your rankings and theirs. point-biserial correlation O Wilcoxon Signed Rank T O Spearman correlation chi-square for goodness-of-fitarrow_forwardWhat is the correlation coefficient with the outlier? rw = What is the correlation coefficient without the outlier? rwo = Would inclusion of the outlier change the evidence for or against a significant linear correlation? No. Including the outlier does not change the evidence regarding a linear correlation. Yes. Including the outlier changes the evidence regarding a linear correlation. Question for thought: Would you always draw the same conclusion with the addition of an outlier?arrow_forwardMatch each correlation to the correspoding scatterplot please.arrow_forward
- 2. Please reference attachmentarrow_forwardurgent pleasearrow_forwardState which correlation coefficient (pears, spearman, point-biased, or phi) should be used given the following information Both factors are interval or ratio scale. Both factors are dichotomous One factor is dichotomous, and the other factor is continuous Both factors are rankedarrow_forward
arrow_back_ios
SEE MORE QUESTIONS
arrow_forward_ios
Recommended textbooks for you
 MATLAB: An Introduction with ApplicationsStatisticsISBN:9781119256830Author:Amos GilatPublisher:John Wiley & Sons Inc
 Probability and Statistics for Engineering and th...StatisticsISBN:9781305251809Author:Jay L. DevorePublisher:Cengage Learning
 Statistics for The Behavioral Sciences (MindTap C...StatisticsISBN:9781305504912Author:Frederick J Gravetter, Larry B. WallnauPublisher:Cengage Learning
 Elementary Statistics: Picturing the World (7th E...StatisticsISBN:9780134683416Author:Ron Larson, Betsy FarberPublisher:PEARSON
 The Basic Practice of StatisticsStatisticsISBN:9781319042578Author:David S. Moore, William I. Notz, Michael A. FlignerPublisher:W. H. Freeman
 Introduction to the Practice of StatisticsStatisticsISBN:9781319013387Author:David S. Moore, George P. McCabe, Bruce A. CraigPublisher:W. H. Freeman

MATLAB: An Introduction with Applications
Statistics
ISBN:9781119256830
Author:Amos Gilat
Publisher:John Wiley & Sons Inc

Probability and Statistics for Engineering and th...
Statistics
ISBN:9781305251809
Author:Jay L. Devore
Publisher:Cengage Learning

Statistics for The Behavioral Sciences (MindTap C...
Statistics
ISBN:9781305504912
Author:Frederick J Gravetter, Larry B. Wallnau
Publisher:Cengage Learning

Elementary Statistics: Picturing the World (7th E...
Statistics
ISBN:9780134683416
Author:Ron Larson, Betsy Farber
Publisher:PEARSON

The Basic Practice of Statistics
Statistics
ISBN:9781319042578
Author:David S. Moore, William I. Notz, Michael A. Fligner
Publisher:W. H. Freeman

Introduction to the Practice of Statistics
Statistics
ISBN:9781319013387
Author:David S. Moore, George P. McCabe, Bruce A. Craig
Publisher:W. H. Freeman