
MATLAB: An Introduction with Applications
6th Edition
ISBN: 9781119256830
Author: Amos Gilat
Publisher: John Wiley & Sons Inc
expand_more
expand_more
format_list_bulleted
Related questions
Concept explainers
Question
I am not sure how to go about finding the critical value for example number 2 when the value is not on the table.
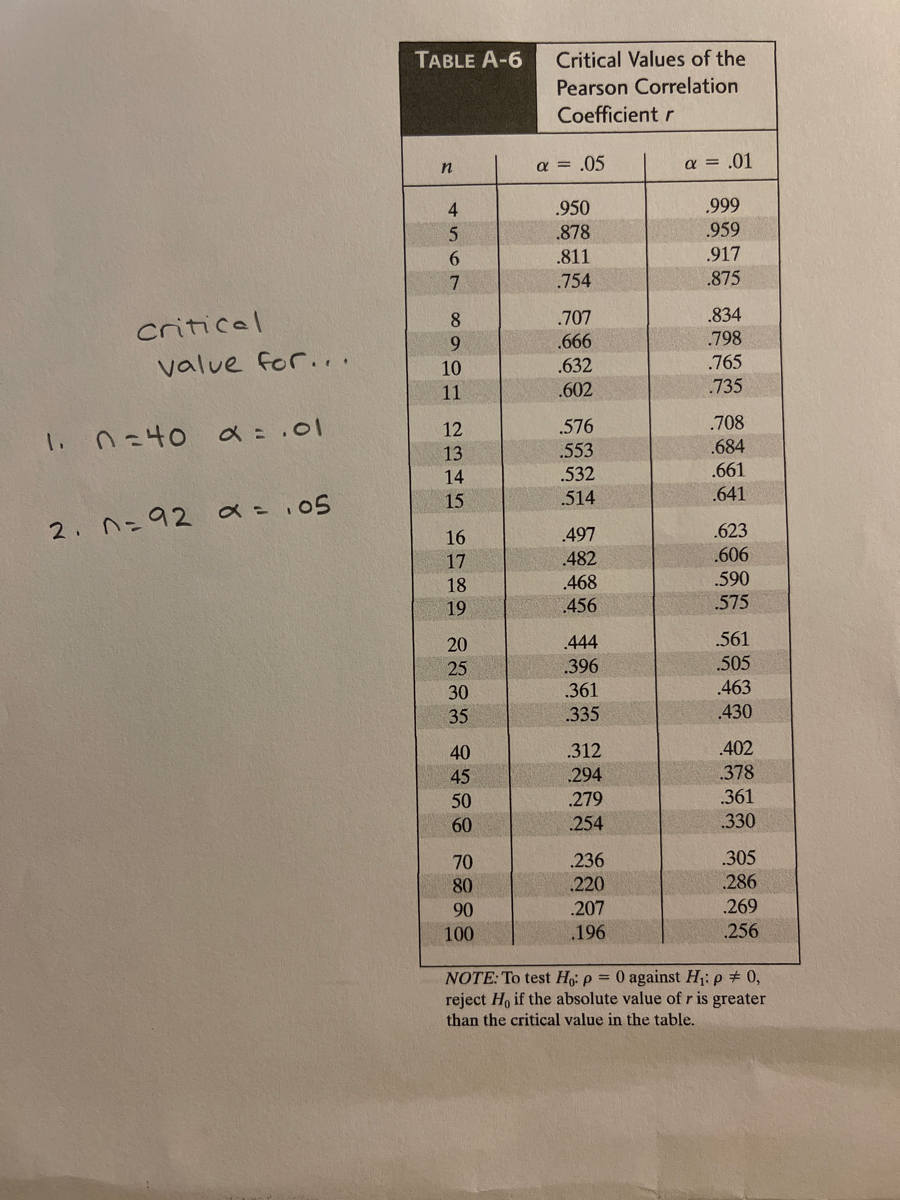

Transcribed Image Text:TABLE A-6
Critical Values of the
Pearson Correlation
Coefficient r
a = .05
a = .01
n
4
.950
.999
.878
.811
.959
.917
6.
.754
.875
.707
.666
criticel
8
.834
9.
.798
value for...
10
.632
.765
11
.602
.735
a = .01
.708
.684
.661
.641
12
.576
13
.553
14
.532
15
.514
2. n=92 a=105
.623
.606
.590
16
.497
17
.482
18
.468
19
456
575
.444
396
.561
.505
20
25
30
.361
.463
35
.335
.430
40
.312
.402
45
294
.378
.361
50
.279
60
.254
.330
.236
.220
70
.305
80
.286
90
.207
.269
100
.196
.256
NOTE: To test Ho: p = 0 against H: p + 0,
reject Ho if the absolute value of r is greater
than the critical value in the table.
Expert Solution
This question has been solved!
Explore an expertly crafted, step-by-step solution for a thorough understanding of key concepts.

This is a popular solution

Trending nowThis is a popular solution!

Step by stepSolved in 2 steps

Knowledge Booster


Learn more about
Need a deep-dive on the concept behind this application? Look no further. Learn more about this topic, statistics and related others by exploring similar questions and additional content below.Similar questions
- A friend of yours wants to compare black rats and white rats and their ability to run a maze. He believes that coffee will make a difference. He sets up a 2 x 5 experiment with the rats (2 levels of rats and 5 levels of types of coffee). After finishing his experiment he runs multiple t-tests on his data. Is there anything wrong with doing this? If so, explain what should be used instead and why?arrow_forwardPlease don't provide handwriting solutionarrow_forwardSuppose an oceanographer monitors the daily salinity of a particular ocean in relation to the temperature of the water. The oceanographer plots the data with temperature, in degrees Celsius (°C), along the horizontal axis and salinity, in parts per thousand (ppt), along the vertical axis. Select the true statement about the data point identified by the arrow. An ocean temperature of 21 °C causes the salinity to be 29 ppt. The predicted salinity is 29 ppt when the ocean temperature for the day is 21 °C. An ocean temperature of 29 °C corresponds to a salinity level of 21 ppt. The observed salinity is 29 ppt when the ocean temperature for the day is 21 °C. There is no relationship between the temperature of the ocean on a given day and salinity.arrow_forward
- A researcher is investigating a new screening tool that is intended to help prevent the onset of breast cancer in young women. Suppose he tests the new device on a group of 10 women. The following table shows the test result and true breast cancer status of each of the women. What can we say about the new device with regards to its accuracy? Patient Test Result True Cancer Status A + + B + + C + - D + - E - + F - + G + - H - + I - - J + -arrow_forwardHow do I find the relative extrema of x3 - 27x?arrow_forwardA researcher wants to investigate the relationship between the hours a student spends studying for a test and the score on the test. The following data is gathered: Hours (x) 20 16 34 23 27 32 18 22 Score (y) 6.5 8.5 7 9.5 7.5 8 Annual (X-X) salary, $1000 Years of (Y-Y) (X-X)(Y-Ÿ) (X-X)? (Y-7)² schooling 20 6.5 -4 -1.25 16 1.5625 16 6. -8 -1.75 14 64 3.0625 34 8.5 10 0.75 7.5 100 0.5625 23 7 -1 -0.75 0.75 1 0.5625 27 3 1.25 3.75 9. 1.5625 32 9.5 8. 1.75 14 64 3.0625 18 7.5 -6 -0.25 1.5 36 0.0625 22 8 -2 0.25 -0.5 4 0.0625 192 62 46 294 10.5 Calculate: a. The regression line of y based on x. b. The estimated test score for a person who studied 28 hours.arrow_forward
- Consider the following model of a market for hats in which Qs is quantity of hats produced, Qd is quantity of hats purchased and P is the price of a hat. Qs=5+12P Qd=50-3P if production conditions change so that Qs=-10+12P, what will be the change in Q*? compared to the value 41, such that Q*=Qs=Qd remains true? a. 4 b. -3 c. -4 d. 3arrow_forwardHow do I solve this problem? I'm not sure what to do.arrow_forwardCan someone walk me through how to find this using excel? I am studying for my final and I am so lost on the first one. The PowerPoint from class is not helping eitherarrow_forward
- The Organization for Economic Cooperation and Development (OECD) consists of 20 industrialized countries. For these nations, the prediction equation relating y = child poverty rate (in percentage points) to x = social expenditure as a percentage of gross domestic product (GDP) is = 22-1.3x. In 2000, the actual child poverty rate ranged from 2.8% (in Finland) to 21.9% (in the U.S.). Social expenditure as a percentage of GDP ranged from 2% (in the United States) to 16% (in Denmark). What is the value of the slope (b) estimated in the linear prediction equation provided above (= 22-1.3x)? Also, interpret the slope. Estimated slope (b): Interpretation of slope:arrow_forwardA quality control engineer studied the relationship between years of experience as a system control engineer and the capacity of the engineer to complete within a given time a complex control design including the debugging of all computer programs and control devices. A group of 25 engineers having widely differing amounts of experience (measured in months of experience) was given the same control design project. The results of the study are given in the following table with y 5 1 if the project was successfully completed in the allocated time and y 5 0 if the project was not successfully completed. a. Determine whether experience is associated with the probability of completing the task. b. Compute the probability of successfully completing the task for an engineer havingarrow_forwardPlease answer quickly and correctly The Samsung plant in Newberry is an assembly plant for home appliances. They assembly three types of appliances including washing machine, dishwasher, and oven (reference by W, R, and O). Each type of appliance is produced in a different assembly line which has some amount of output per day. Let’s imagine a quality engineer has gathered the following data in Table 1 from a small period of production, counting the number of products with defects and without defects. Let D indicates a defective product and ND indicates not defective. Washing Machine Dishwasher Oven: Defective 5 2 15 Not defective 63 86 45 Table 1: Number of products with and without defects by type a. Overall, what is the probability that a randomly selected product is defective? b. What is the probability that a randomly selected product is an oven? c. What is the probability that a product is defective, given it is an oven? d. What is the probability that a product is…arrow_forward
arrow_back_ios
SEE MORE QUESTIONS
arrow_forward_ios
Recommended textbooks for you
- MATLAB: An Introduction with ApplicationsStatisticsISBN:9781119256830Author:Amos GilatPublisher:John Wiley & Sons Inc
 Probability and Statistics for Engineering and th...StatisticsISBN:9781305251809Author:Jay L. DevorePublisher:Cengage Learning
 Statistics for The Behavioral Sciences (MindTap C...StatisticsISBN:9781305504912Author:Frederick J Gravetter, Larry B. WallnauPublisher:Cengage Learning
  Elementary Statistics: Picturing the World (7th E...StatisticsISBN:9780134683416Author:Ron Larson, Betsy FarberPublisher:PEARSON
 The Basic Practice of StatisticsStatisticsISBN:9781319042578Author:David S. Moore, William I. Notz, Michael A. FlignerPublisher:W. H. Freeman
 Introduction to the Practice of StatisticsStatisticsISBN:9781319013387Author:David S. Moore, George P. McCabe, Bruce A. CraigPublisher:W. H. Freeman
MATLAB: An Introduction with Applications
Statistics
ISBN:9781119256830
Author:Amos Gilat
Publisher:John Wiley & Sons Inc
Probability and Statistics for Engineering and th...
Statistics
ISBN:9781305251809
Author:Jay L. Devore
Publisher:Cengage Learning
Statistics for The Behavioral Sciences (MindTap C...
Statistics
ISBN:9781305504912
Author:Frederick J Gravetter, Larry B. Wallnau
Publisher:Cengage Learning
Elementary Statistics: Picturing the World (7th E...
Statistics
ISBN:9780134683416
Author:Ron Larson, Betsy Farber
Publisher:PEARSON
The Basic Practice of Statistics
Statistics
ISBN:9781319042578
Author:David S. Moore, William I. Notz, Michael A. Fligner
Publisher:W. H. Freeman
Introduction to the Practice of Statistics
Statistics
ISBN:9781319013387
Author:David S. Moore, George P. McCabe, Bruce A. Craig
Publisher:W. H. Freeman