
MATLAB: An Introduction with Applications
6th Edition
ISBN: 9781119256830
Author: Amos Gilat
Publisher: John Wiley & Sons Inc
expand_more
expand_more
format_list_bulleted
Related questions
Question
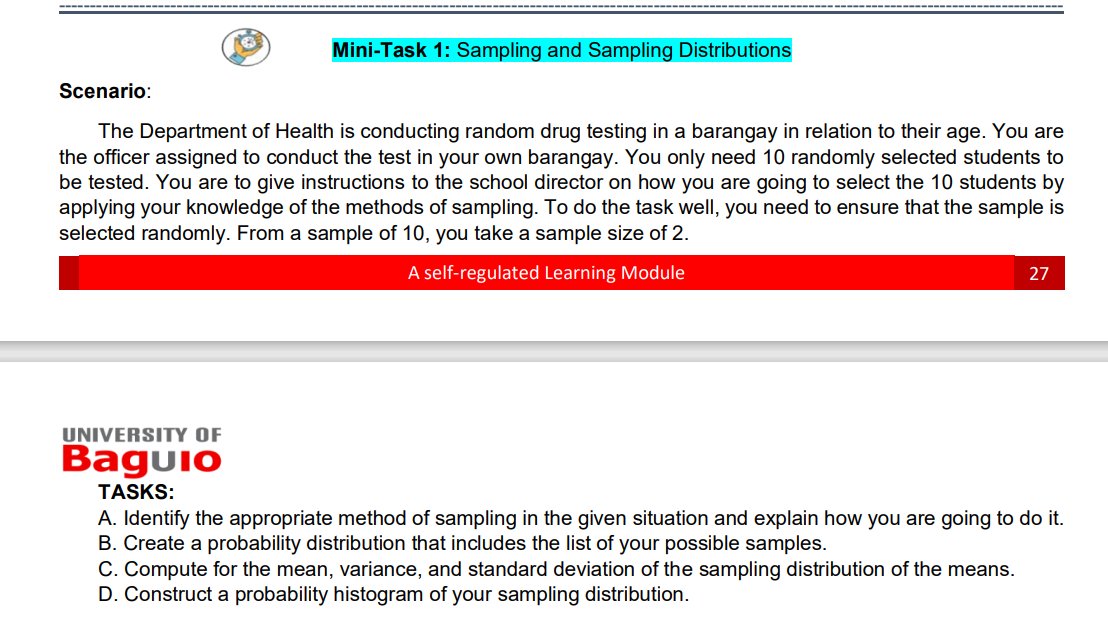

Transcribed Image Text:Mini-Task 1: Sampling and Sampling Distributions
Scenario:
The Department of Health is conducting random drug testing in a barangay in relation to their age. You are
the officer assigned to conduct the test in your own barangay. You only need 10 randomly selected students to
be tested. You are to give instructions to the school director on how you are going to select the 10 students by
applying your knowledge of the methods of sampling. To do the task well, you need to ensure that the sample is
selected randomly. From a sample of 10, you take a sample size of 2.
A self-regulated Learning Module
UNIVERSITY OF
Baguio
TASKS:
27
A. Identify the appropriate method of sampling in the given situation and explain how you are going to do it.
B. Create a probability distribution that includes the list of your possible samples.
C. Compute for the mean, variance, and standard deviation of the sampling distribution of the means.
D. Construct a probability histogram of your sampling distribution.

Transcribed Image Text:Appendix A. Minitask 1 Rubrics
Below Standard:
2
Chosen sampling
method is wrong.
Criteria
Sampling
Method
Probability
Distrbution and
histogram
Computations
(mean, variance,
and standard
deviation)
Neatness and
format
The probability
distribution and
histogram has
correctly constructed
with correct possible
samples with its
corresponding
probability.
Computations are
complete and with
correct solutions and
answers.
Their paper did not
follow the format.
Rubrics
Satisfactory:
3
Chosen sampling
method is correct
but computations
are very limited.
The probability
distribution and
histogram has 2
errors but with
correct possible
samples with its
corresponding
probability.
Computations are
complete and with
correct solutions
but wrong answers.
Their paper did not
follow some of the
format but there is
no erasure in it.
Accomplished:
4
Chosen sampling
method is correct
and computations
are complete.
The probability
distribution and
histogram has 3-
4errors in
construction and
content.
Computations are
incomplete and
with correct
solutions
Excellent:
5
Chosen sampling
method is correct
and computations
are excellent.
The probability
distribution and
histogram is poorly
constructed with
much errors seen.
Computations are
incomplete and with
wrong solutions
and answers
Their paper
Their paper
followed the given followed the
format.
required format and
there is no erasure
of any kind.
Total =
Score
X2
X3
X3
X2
/50
Expert Solution
This question has been solved!
Explore an expertly crafted, step-by-step solution for a thorough understanding of key concepts.

This is a popular solution

Trending nowThis is a popular solution!

Step by stepSolved in 3 steps

Knowledge Booster

Similar questions
- The purpose and intent of the assignment is to help you better understand the sampling distribution of the mean. The class sampling exercise In class we conducted a sampling exercise. The population consisted of 25 elements. The possible values for the elements in the population ranged from 1 to 9 and were distributed as follows: Value Frequency Proportion Percentage 1 1 0.04 4% 2 2 0.08 8% 3 3 0.12 12% 4 4 0.16 16% 5 5 0.2 20% 6 4 0.16 16% 7 3 0.12 12% 8 2 0.08 8% 9 1 0.04 4% As in the class exercise, 10 elements are drawn replacing each element before the next is drawn. This was done 1000 times. The data set is given in a separate…arrow_forwardBeef Consumption. According to Food Consumption, Prices, and Expenditures, published by the U.S. Department of Agriculture, the mean consumption of beef per person in 2011 was 57.5 lb. A sample of 40 people taken this year yielded the data, in pounds, on last year’s beef consumption given on the WeissStats site. Use the technology of your choice to do the following. a. Obtain a normal probability plot, a boxplot, a histogram, and a stem-and-leaf diagram of the data on beef consumptions. b. Decide, at the 5% significance level, whether last year’s mean beef consumption is less than the 2011 mean of 57.5 lb. Apply the onemean t-test. c. The sample data contain four potential outliers: 0, 0, 0, and 13. Remove those four observations, repeat the hypothesis test in part (b), and compare your result with that obtained in part (b). d. Assuming that the four potential outliers are not recording errors, comment on the advisability of removing them from the sample data before performing the…arrow_forwardDetermine whether the sampling is dependent or independent. Indicate whether the response variable is qualitative or quantitative.A psychologist wants to measure the effect of music on memory. He randomly selects 80 students and measures their scores on a memory test conducted in silence. The next day he measures their scores on a similar test conducted while classical music is playing. The mean score without music is compared to the mean score with music. Group of answer choices a.quantitative, dependent b.qualitative, independent c.qualitative, dependent d.quantitative, independentarrow_forward
- There are only 4 teams in a league. The winning percentages of the teams are given as follows: Team A: 58%, Team B: 30%, Team C: 62% and Team D: 82%. Calculate the standard deviation.arrow_forwardThe home run percentage is the number of home runs per 100 times at bat. A random sample of 43 professional baseball players gave the following data for home run percentages.arrow_forwardNumber of persons in the household 1 2 A. Below is a distribution of the variable "hompop" from the 2016 General Social Survey dataset. This variable is a measure of the number of people in each respondent's household. Use the table to answer the following questions. 3 4 5 7 8 9 10 11 Total www Freq. 850 1,069 436 278 139 58 19 2,867 percent 29.65 37.29 15.21 9.70 4.85 2.02 0.66 0.31 0.24 0.03 0.03 100.00 Cum. 29.65 66.93 82.14 91.84 96.69 98.71 99.37 99.69 99.93 99.97 100.00 1arrow_forward
arrow_back_ios
arrow_forward_ios
Recommended textbooks for you
- MATLAB: An Introduction with ApplicationsStatisticsISBN:9781119256830Author:Amos GilatPublisher:John Wiley & Sons Inc
 Probability and Statistics for Engineering and th...StatisticsISBN:9781305251809Author:Jay L. DevorePublisher:Cengage Learning
 Statistics for The Behavioral Sciences (MindTap C...StatisticsISBN:9781305504912Author:Frederick J Gravetter, Larry B. WallnauPublisher:Cengage Learning
  Elementary Statistics: Picturing the World (7th E...StatisticsISBN:9780134683416Author:Ron Larson, Betsy FarberPublisher:PEARSON
 The Basic Practice of StatisticsStatisticsISBN:9781319042578Author:David S. Moore, William I. Notz, Michael A. FlignerPublisher:W. H. Freeman
 Introduction to the Practice of StatisticsStatisticsISBN:9781319013387Author:David S. Moore, George P. McCabe, Bruce A. CraigPublisher:W. H. Freeman
MATLAB: An Introduction with Applications
Statistics
ISBN:9781119256830
Author:Amos Gilat
Publisher:John Wiley & Sons Inc
Probability and Statistics for Engineering and th...
Statistics
ISBN:9781305251809
Author:Jay L. Devore
Publisher:Cengage Learning
Statistics for The Behavioral Sciences (MindTap C...
Statistics
ISBN:9781305504912
Author:Frederick J Gravetter, Larry B. Wallnau
Publisher:Cengage Learning
Elementary Statistics: Picturing the World (7th E...
Statistics
ISBN:9780134683416
Author:Ron Larson, Betsy Farber
Publisher:PEARSON
The Basic Practice of Statistics
Statistics
ISBN:9781319042578
Author:David S. Moore, William I. Notz, Michael A. Fligner
Publisher:W. H. Freeman
Introduction to the Practice of Statistics
Statistics
ISBN:9781319013387
Author:David S. Moore, George P. McCabe, Bruce A. Craig
Publisher:W. H. Freeman