MATLAB: An Introduction with Applications
6th Edition
ISBN: 9781119256830
Author: Amos Gilat
Publisher: John Wiley & Sons Inc
expand_more
expand_more
format_list_bulleted
Concept explainers
Question
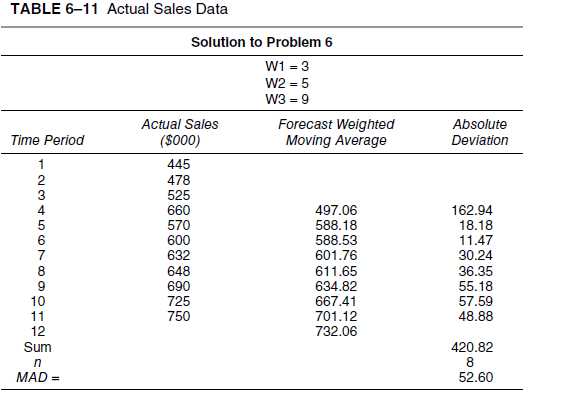
Using the data in Table 6–11, answer the following:
a. What is the slope?
b. What is the intercept?
c. Write the regression equation.
d. Calculate a regression forecast for month 25.

Transcribed Image Text:TABLE 6–11 Actual Sales Data
Solution to Problem 6
W1 = 3
W2 = 5
W3 = 9
Actual Sales
Forecast Weighted
Moving Average
Absolute
Time Period
($00)
Deviation
445
478
525
660
570
600
632
648
690
725
1
2
162.94
18.18
11.47
30.24
4.
497.06
588.18
588.53
601.76
611.65
634.82
667.41
701.12
732.06
36.35
55.18
10
11
12
57.59
48.88
750
Sum
420.82
in
MAD =
52.60
Expert Solution
This question has been solved!
Explore an expertly crafted, step-by-step solution for a thorough understanding of key concepts.
This is a popular solution
Trending nowThis is a popular solution!
Step by stepSolved in 4 steps

Knowledge Booster
Learn more about
Need a deep-dive on the concept behind this application? Look no further. Learn more about this topic, statistics and related others by exploring similar questions and additional content below.Similar questions
- C) If Ariel converted her variables into standard deviation units and then computed her regression equation, what would her slope and intercept be?arrow_forward-Using the data in Table 6–11, answer the following: What is the slope? What is the intercept? Write the regression equation. Calculate a regression forecast for month 25.arrow_forwardam. 13.arrow_forward
- Hazel has four very short children and wants to predict how tall the kids will be in the future, as they get older she measures their height and finds: Rufus, age 3, 46 cm in height Angus, age 4, 52 cm in height matilda, age 6, 63 cm in height Lao age 8, 85 cm in height Round to the nearest integers, what is the regression equation computed from the dataarrow_forwardBelow is the output from regression. Use the p-value and decide if the equation is good to use for forecasting. Group of answer choices A.) p-value = 82 - equation is good to use B.) p-value = 0.15 - equation is not good to use C.) p-value = 0.18 - equation is not good to use D.) p-value = -16 - equation is good to usearrow_forwardA. Develop an estimated regression equation that can be used to predict the price of the stock based on the number of shares of company's stocks sold and the volume of exchange. B. Interpret the coefficients of the estimated regression equation that you found in Part a. C. If in a given day, the number of shares of the company that were sold was 94,500 and the volume of exchange on the New York Stock Exchange was 16 million, what would you expect the price of the stock to be?arrow_forward
- What is the variable requirement for a chi-square analysis?arrow_forwardWe want to predict the selling price of a house in Newburg Park, Florida, based on the distance the house lies from the beach. Suppose that we're given the data in the table below. These data detail the distance from the beach (x, in miles) and the selling price (y, in thousands of dollars) for each of a sample of sixteen homes sold in Newburg Park in the past year. The data are plotted in the scatter plot in Figure 1. Distance from the beach, x (in miles) 5.1 6.2 9.5 10.3 10.7 5.3 12.6 13.0 19.4 8.2 5.2 3.8 9.0 11.7 11.5 8.3 Send data to calculator V Selling price, y (in thousands of dollars) 263.5 274.6 238.6 223.7 267.1 306.2 202.5 267.7 217.3 224.7 241.0 312.0 284.6 210.9 185.6 294.2 Send data to Excel thousands of dollars) Selling price 350+ 300+ Figure 1 250 200 150. 0 Distance from the beach (in miles) Español F00 ? D 1 As Marrow_forward
arrow_back_ios
arrow_forward_ios
Recommended textbooks for you
 MATLAB: An Introduction with ApplicationsStatisticsISBN:9781119256830Author:Amos GilatPublisher:John Wiley & Sons Inc
 Probability and Statistics for Engineering and th...StatisticsISBN:9781305251809Author:Jay L. DevorePublisher:Cengage Learning
 Statistics for The Behavioral Sciences (MindTap C...StatisticsISBN:9781305504912Author:Frederick J Gravetter, Larry B. WallnauPublisher:Cengage Learning
 Elementary Statistics: Picturing the World (7th E...StatisticsISBN:9780134683416Author:Ron Larson, Betsy FarberPublisher:PEARSON
 The Basic Practice of StatisticsStatisticsISBN:9781319042578Author:David S. Moore, William I. Notz, Michael A. FlignerPublisher:W. H. Freeman
 Introduction to the Practice of StatisticsStatisticsISBN:9781319013387Author:David S. Moore, George P. McCabe, Bruce A. CraigPublisher:W. H. Freeman

MATLAB: An Introduction with Applications
Statistics
ISBN:9781119256830
Author:Amos Gilat
Publisher:John Wiley & Sons Inc

Probability and Statistics for Engineering and th...
Statistics
ISBN:9781305251809
Author:Jay L. Devore
Publisher:Cengage Learning

Statistics for The Behavioral Sciences (MindTap C...
Statistics
ISBN:9781305504912
Author:Frederick J Gravetter, Larry B. Wallnau
Publisher:Cengage Learning

Elementary Statistics: Picturing the World (7th E...
Statistics
ISBN:9780134683416
Author:Ron Larson, Betsy Farber
Publisher:PEARSON

The Basic Practice of Statistics
Statistics
ISBN:9781319042578
Author:David S. Moore, William I. Notz, Michael A. Fligner
Publisher:W. H. Freeman

Introduction to the Practice of Statistics
Statistics
ISBN:9781319013387
Author:David S. Moore, George P. McCabe, Bruce A. Craig
Publisher:W. H. Freeman