
MATLAB: An Introduction with Applications
6th Edition
ISBN: 9781119256830
Author: Amos Gilat
Publisher: John Wiley & Sons Inc
expand_more
expand_more
format_list_bulleted
Related questions
Question
A. Write the equation of the regression line.
B. Interpret each one of the slopes in this context.
C. Calculate the estimated number of days absent and the residual for the first observation in the data set: a student who is aboriginal, male, a slow learner, and missed 2 days of school.
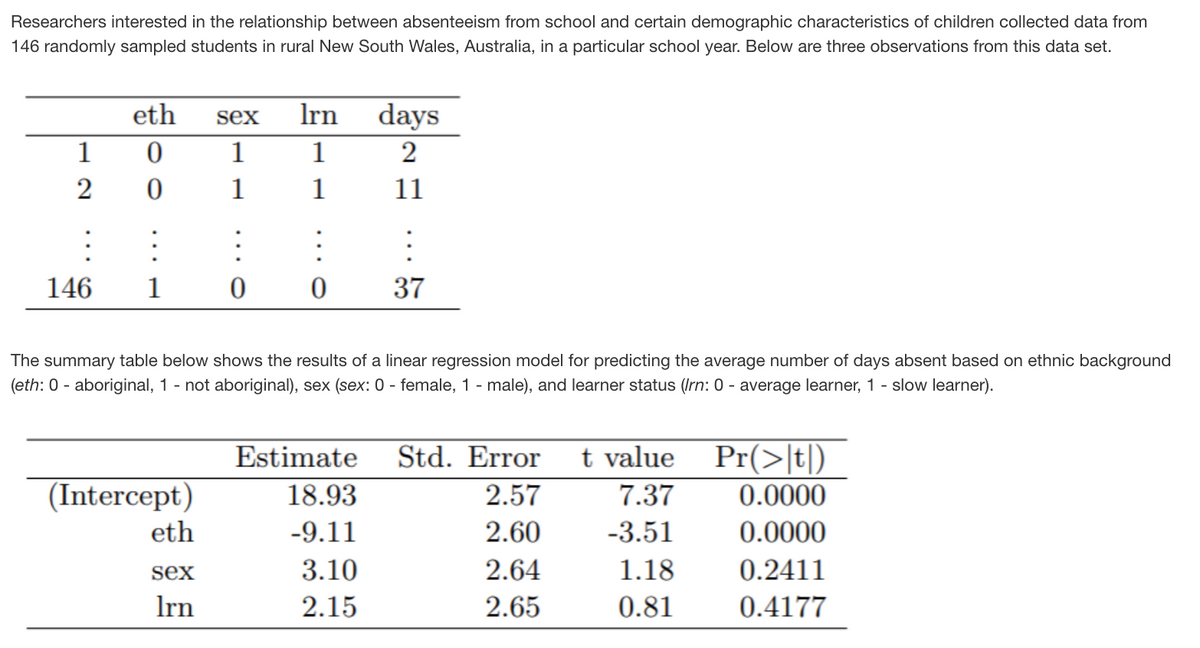

Transcribed Image Text:Researchers interested in the relationship between absenteeism from school and certain demographic characteristics of children collected data from
146 randomly sampled students in rural New South Wales, Australia, in a particular school year. Below are three observations from this data set.
eth
Irn
days
sex
1
1
1
2
2
1
1
11
:
146
1
37
The summary table below shows the results of a linear regression model for predicting the average number of days absent based on ethnic background
(eth: 0 - aboriginal, 1 - not aboriginal), sex (sex: 0 - female, 1 - male), and learner status (Irn: 0 - average learner, 1 - slow learner).
Estimate
Std. Error
t value Pr(>|t|)
(Intercept)
18.93
2.57
7.37
0.0000
eth
-9.11
2.60
-3.51
0.0000
sex
3.10
2.64
1.18
0.2411
Irn
2.15
2.65
0.81
0.4177
Expert Solution
This question has been solved!
Explore an expertly crafted, step-by-step solution for a thorough understanding of key concepts.

This is a popular solution

Trending nowThis is a popular solution!

Step by stepSolved in 2 steps with 1 images

Knowledge Booster

Similar questions
- A real estate analyst believes that the three main factors that influence an apartment's rent in a college town are the number of bedrooms, the number of bathrooms, and the apartment's square footage. For 40 apartments, she collects data on the rent (y, in $), the number of bedrooms (x1), the number of bathrooms (x2), and its square footage (X3). The following table shows a portion of the regression results. ANOVA Significance df SS MS F F gression Residual 3 5694717 1898239 50.88 4.99E-13 36 1343176 37310 Total 39 7037893 Standard Upper 95% Coefficients Error t Stat p-value_Lower 95% Intercept 300 84.0 3.57 0.0010 130.03 470.79 Bed 226 60.3 3.75 0.0006 103.45 348.17 Bath 89 55.9 1.59 0.1195 -24.24 202.77 Sqft 0.2 0.09 2.22 0.0276 0.024 0.39 What would be the rent for a 1000-square-foot apartment that has 2 bedrooms and 2 bathrooms? $840 $1,335 $1,130 $1,260arrow_forwardFor the provided data, develop a regression model for overall satisfaction as a function of years of service and department that has the largest R. Note that the categorical variable department has multiple levels and will require the use of multiple dummy variables. Which department, if any, has the highest impact on roduction satisfaction? Production Production E Click the icon to view the job satisfaction data. Determine the regression model for overall satisfaction as a function of years of service and department that has the largest R. Let "Administrative" be the baseline department, let X, represent Maintenance, let X, represent Management, let X, represent Production, let X, represent Quality Control, and let Xg represent Shipping / Receiving, coding each department variable with a 1 if the person is in that department and 0 otherwise. In addition, let Xe represent Years. Enter the terms of the equation so that the X-values are in ascending numerical order by base. Select the…arrow_forwardSolve attached photo.arrow_forward
- The data show the chest size and weight of several bears. Find the regression equation, letting chest size be the independent (x) variable. Then find the best predicted weight of a bear with a chest size of 58 inches. Is the result close to the actual weight of 572 pounds? Use a significance level of 0.05. Chest size (inches) 46 57 53 41 40 40 Weight (pounds) 384 580 542 358 306 320 LOADING... Click the icon to view the critical values of the Pearson correlation coefficient r. What is the regression equation? y=nothing+nothingx (Round to one decimal place as needed.)arrow_forwardA. run a simple regression- dependent variable is Weeks, independent variable is Age. B. run a multiple regression with dependent variable weeks and independent variable-age, married, head, manager and sales. C. Create the regular and standardized residual plots for both. Please show the tables when entering values of the regression for both the outputs and the scatter plots.arrow_forward. Determine the regression equation using values you create for x and y for at least 10 pairs of data. Show the regression equation, correlation coefficient, and coefficient of determination. Then switch the x and y values for each data point. Based on that, again show the regression equation, correlation coefficient, and coefficient of determination. Discuss the similarities and differences between the results.arrow_forward
- The datasetBody.xlsgives the percent of weight made up of body fat for 100 men as well as other variables such as Age, Weight (lb), Height (in), and circumference (cm) measurements for the Neck, Chest, Abdomen, Ankle, Biceps, and Wrist. We are interested in predicting body fat based on abdomen circumference. Find the equation of the regression line relating to body fat and abdomen circumference. Make a scatter-plot with a regression line. What body fat percent does the line predict for a person with an abdomen circumference of 110 cm? One of the men in the study had an abdomen circumference of 92.4 cm and a body fat of 22.5 percent. Find the residual that corresponds to this observation. Bodyfat Abdomen 32.3 115.6 22.5 92.4 22 86 12.3 85.2 20.5 95.6 22.6 100 28.7 103.1 21.3 89.6 29.9 110.3 21.3 100.5 29.9 100.5 20.4 98.9 16.9 90.3 14.7 83.3 10.8 73.7 26.7 94.9 11.3 86.7 18.1 87.5 8.8 82.8 11.8 83.3 11 83.6 14.9 87 31.9 108.5 17.3…arrow_forwardListed below are the numbers of commuters and the number of parking spaces at different Metro-North railroad stations. Use technology (calculator) to help you answer the following, and round to the 3 decimal places where rounding is necessary. . a. Find the linear regression line y = a + bx. b. Are the variables positively or negatively related? c. Find and interpret r2. Make sure to include what it means specific to this data set. d. Use your regression line to make a prediction for the number of parking spaces for a station with 900 e. Identify and interpret the slope of the linear model.arrow_forwardState the regression equation and use it to predict taxes for a house with lot size 10K.arrow_forward
- Refer to the data set: x -1 1 -2 3 0 2 y 9 2 15 1 4 1.5 Part a: Make a scatterplot and determine which type of model best fits the data.Part b: Find the regression equation, round decimals to one place.Part c: Use the equation from Part b to determine y when x = 5.arrow_forwardNeed regression equation, graph, and predict the value of y for a-d.arrow_forwardRefer to the Baseball 2018 data, which reports information on the 2018 Major League Baseball season. Let attendance be the dependent variable and total team salary be the independent variable. Determine the regression equation and answer the following questions. Click here for the Excel Data Filea-1. Draw a scatter diagram.1. On the graph below, use the point tool to plot the point corresponding to the Attendance and its team salary (Salary 1).2. Repeat the process for the remainder of the sample Salary 2, Salary 3, … ).3. To enter exact coordinates, double-click on the point and enter the exact coordinates of x and y. a-2. From the diagram, does there seem to be a direct relationship between the two variables?multiple choice 1 Yes No b. What is the expected attendance for a team with a salary of $100.0 million? (Round your answer to 4 decimal places.) c. If the owners pay an additional $30 million, how many more people could they expect to attend? (Round your answer to 3…arrow_forward
arrow_back_ios
SEE MORE QUESTIONS
arrow_forward_ios
Recommended textbooks for you
- MATLAB: An Introduction with ApplicationsStatisticsISBN:9781119256830Author:Amos GilatPublisher:John Wiley & Sons Inc
 Probability and Statistics for Engineering and th...StatisticsISBN:9781305251809Author:Jay L. DevorePublisher:Cengage Learning
 Statistics for The Behavioral Sciences (MindTap C...StatisticsISBN:9781305504912Author:Frederick J Gravetter, Larry B. WallnauPublisher:Cengage Learning
  Elementary Statistics: Picturing the World (7th E...StatisticsISBN:9780134683416Author:Ron Larson, Betsy FarberPublisher:PEARSON
 The Basic Practice of StatisticsStatisticsISBN:9781319042578Author:David S. Moore, William I. Notz, Michael A. FlignerPublisher:W. H. Freeman
 Introduction to the Practice of StatisticsStatisticsISBN:9781319013387Author:David S. Moore, George P. McCabe, Bruce A. CraigPublisher:W. H. Freeman
MATLAB: An Introduction with Applications
Statistics
ISBN:9781119256830
Author:Amos Gilat
Publisher:John Wiley & Sons Inc
Probability and Statistics for Engineering and th...
Statistics
ISBN:9781305251809
Author:Jay L. Devore
Publisher:Cengage Learning
Statistics for The Behavioral Sciences (MindTap C...
Statistics
ISBN:9781305504912
Author:Frederick J Gravetter, Larry B. Wallnau
Publisher:Cengage Learning
Elementary Statistics: Picturing the World (7th E...
Statistics
ISBN:9780134683416
Author:Ron Larson, Betsy Farber
Publisher:PEARSON
The Basic Practice of Statistics
Statistics
ISBN:9781319042578
Author:David S. Moore, William I. Notz, Michael A. Fligner
Publisher:W. H. Freeman
Introduction to the Practice of Statistics
Statistics
ISBN:9781319013387
Author:David S. Moore, George P. McCabe, Bruce A. Craig
Publisher:W. H. Freeman