MATLAB: An Introduction with Applications
6th Edition
ISBN: 9781119256830
Author: Amos Gilat
Publisher: John Wiley & Sons Inc
expand_more
expand_more
format_list_bulleted
Question

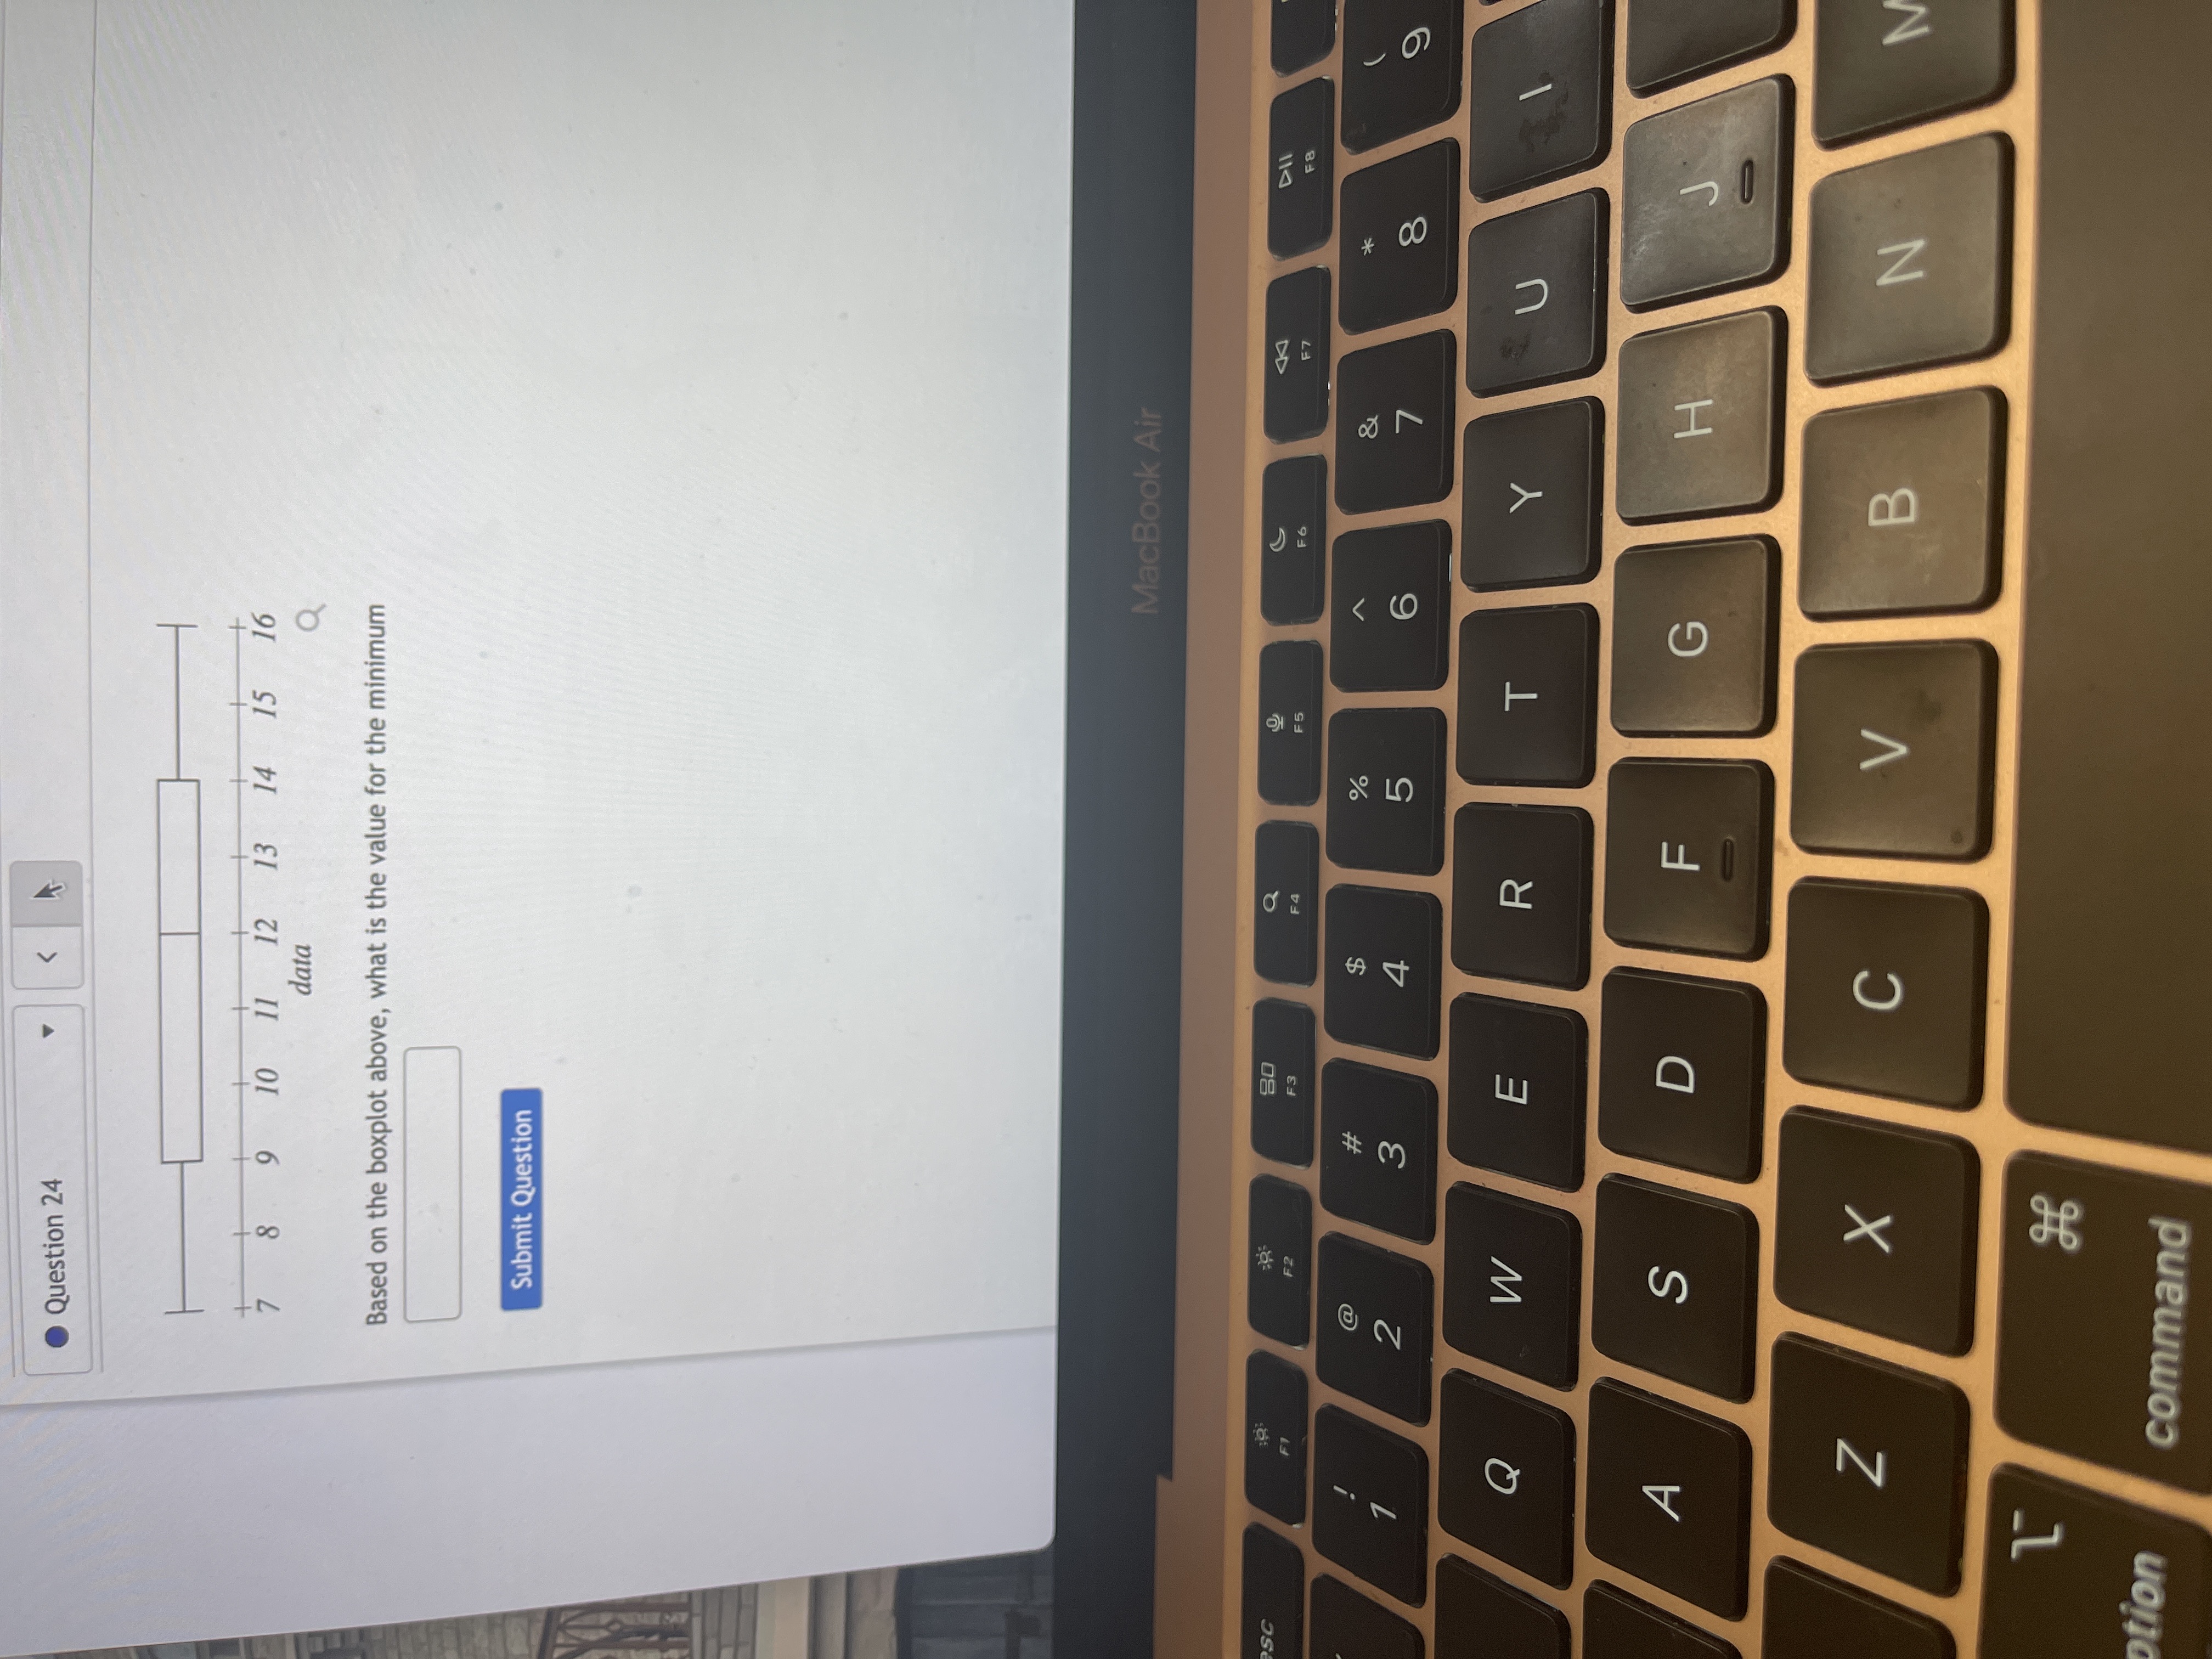
Transcribed Image Text:* 00
T
V>
Question 24
>
+
14
15 16
+
12
13
II
data
8.
6.
Based on the boxplot above, what is the value for the minimum
Submit Question
MacBook Air
08
114
F4
F5
23
2$
3.
R
A
H.
B.
otion
command
Expert Solution
arrow_forward
Step 1
Solution :
A box plot consist of Minimum, first quartile, median, third quartile and maximum.
Step by stepSolved in 3 steps with 2 images

Knowledge Booster
Similar questions
- help please answer in text form with proper workings and explanation for each and every part and steps with concept and introduction no AI no copy paste remember answer must be in proper format with all workingarrow_forwardAdela Noriegam, a researcher wants to determine how employee salaries at a certain company are related to the length of employment, previous experience, and education. The researcher selects eight employees from the company and obtains the following data: Employee Salary,y Employment (in yrs), x1 Employment (in yrs), x2 Employment (in yrs), x3 A 57310 10 2 16 B 57380 5 6 16 C 54135 4 1 12 D 56985 6 5 14 E 58715 8 8 16 F 60000 20 0 12 G 59400 9 4 18 H 60720 15 7 17 What is the regression equation? Leave your answer in 2 decimal places Y = ()+() +() +arrow_forwardWhat is the 5 number summaries?arrow_forward
- Use the given minimum and maximum data entries, and the number of classes, to find the class width, the lower class limits, and the upper class limits. minimum=16, maximum=121, 8 classes Question content area bottom Part 1 The class width is enter your response here . (Type a whole number.) Part 2 Choose the correct lower class limits below. A. 16, 29, 44, 57, 71, 86, 99, 114 B. 30, 43, 58, 72, 86, 99, 113, 127 C. 16, 30, 44, 58, 72, 86, 100, 114 D. 29, 43, 58, 71, 85, 99, 114, 127 Part 3 Choose the correct upper class limits below. A. 30, 44, 58, 72, 86, 99, 114, 127 B. 29, 43, 57, 71, 85, 99, 113, 127 C. 29, 43, 58, 72, 85, 99, 113, 127 D. 30, 44, 57, 71, 86, 99, 114, 127arrow_forwardThe numerical measure of a data set that represents the "middle value" which separates the data into two equally sized groups, with the same number of data values below this measure and the same number of data values above this measure, is called the __________ of the data set. A) Mean B) Median C) Modearrow_forwardUse the given minimum and maximum data entries, and the number of classes, to find the class width, the lower class limits, and the upper class limits. minimum=9, maximum=53, 7 classes. What is the class width?arrow_forward
arrow_back_ios
arrow_forward_ios
Recommended textbooks for you
 MATLAB: An Introduction with ApplicationsStatisticsISBN:9781119256830Author:Amos GilatPublisher:John Wiley & Sons Inc
 Probability and Statistics for Engineering and th...StatisticsISBN:9781305251809Author:Jay L. DevorePublisher:Cengage Learning
 Statistics for The Behavioral Sciences (MindTap C...StatisticsISBN:9781305504912Author:Frederick J Gravetter, Larry B. WallnauPublisher:Cengage Learning
 Elementary Statistics: Picturing the World (7th E...StatisticsISBN:9780134683416Author:Ron Larson, Betsy FarberPublisher:PEARSON
 The Basic Practice of StatisticsStatisticsISBN:9781319042578Author:David S. Moore, William I. Notz, Michael A. FlignerPublisher:W. H. Freeman
 Introduction to the Practice of StatisticsStatisticsISBN:9781319013387Author:David S. Moore, George P. McCabe, Bruce A. CraigPublisher:W. H. Freeman

MATLAB: An Introduction with Applications
Statistics
ISBN:9781119256830
Author:Amos Gilat
Publisher:John Wiley & Sons Inc

Probability and Statistics for Engineering and th...
Statistics
ISBN:9781305251809
Author:Jay L. Devore
Publisher:Cengage Learning

Statistics for The Behavioral Sciences (MindTap C...
Statistics
ISBN:9781305504912
Author:Frederick J Gravetter, Larry B. Wallnau
Publisher:Cengage Learning

Elementary Statistics: Picturing the World (7th E...
Statistics
ISBN:9780134683416
Author:Ron Larson, Betsy Farber
Publisher:PEARSON

The Basic Practice of Statistics
Statistics
ISBN:9781319042578
Author:David S. Moore, William I. Notz, Michael A. Fligner
Publisher:W. H. Freeman

Introduction to the Practice of Statistics
Statistics
ISBN:9781319013387
Author:David S. Moore, George P. McCabe, Bruce A. Craig
Publisher:W. H. Freeman