A First Course in Probability (10th Edition)
10th Edition
ISBN: 9780134753119
Author: Sheldon Ross
Publisher: PEARSON
expand_more
expand_more
format_list_bulleted
Question

Transcribed Image Text:WWW!

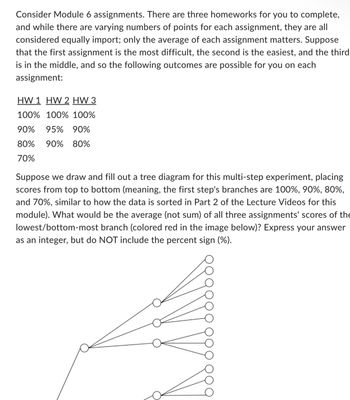
Transcribed Image Text:Consider Module 6 assignments. There are three homeworks for you to complete,
and while there are varying numbers of points for each assignment, they are all
considered equally import; only the average of each assignment matters. Suppose
that the first assignment is the most difficult, the second is the easiest, and the third
is in the middle, and so the following outcomes are possible for you on each
assignment:
HW 1 HW 2 HW 3
100% 100% 100%
90% 95% 90%
80% 90% 80%
70%
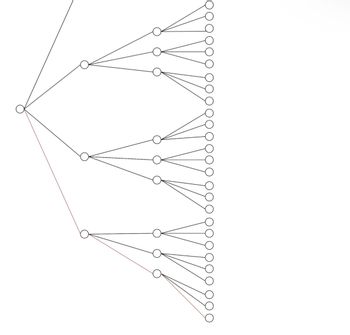
Suppose we draw and fill out a tree diagram for this multi-step experiment, placing
scores from top to bottom (meaning, the first step's branches are 100%, 90%, 80%,
and 70%, similar to how the data is sorted in Part 2 of the Lecture Videos for this
module). What would be the average (not sum) of all three assignments' scores of the
lowest/bottom-most branch (colored red in the image below)? Express your answer
as an integer, but do NOT include the
percent
sign
(%).
W
Expert Solution
This question has been solved!
Explore an expertly crafted, step-by-step solution for a thorough understanding of key concepts.
This is a popular solution
Trending nowThis is a popular solution!
Step by stepSolved in 2 steps with 1 images

Knowledge Booster
Similar questions
- Split the Bill?A recent study was conducted to compare the cost of restaurant meals when people pay individually versus splitting the bill as a group. In the experiment 48 subjects were randomly assigned to eight groups of six diners each. Half of the people were told they they would each be responsible for individual meals costs and the other half were told to split the cost equally among the six people at the table. The data in SplitBill includes the cost of what each person ordered (in Israeli shekels) and the payment method (Individual or Split). Use StatKey or other technology to construct a randomization distribution using these data to test whether there is sufficient evidence to conclude that the mean cost is lower when diners are paying individually than when they split the bill equally. Here is the link to the data: http://www.lock5stat.com/datasets/SplitBill.txtarrow_forwardThis is a SAS question. You want to randomly assign 48 subjects into two groups (Placebo and Drug). Write a DATA step to do this in such a way as to ensure there are exactly 24 subjects in each group. Can you think of how to do this so that in each group of eight subjects, there are exactly four Placebo and four Drug assignments? (Hint: Create six blocks of eight subjects each.) I know how to do the first part, it is the second part that is hard for me to figure out. Thank you!arrow_forwardThe Consumer Reports Restaurant Customer Satisfaction Survey is based upon 148,599 visits to full-service restaurant chains.t One of the variables in the study is meal price, the average amount paid per person for dinner and drinks, minus the tip. Suppose a reporter for the Sun Coast times thought that it would be of interest to her readers to conduct a similar study for restaurants located on the Grand Strand section in Myrtle Beach, South Carolina. The reporter selected a sample of 8 seafood restaurants, 8 Italian restaurants, and 8 steakhouses. The following data show the meal prices ($) obtained for the 24 restaurants sampled. Italian Seafood Steakhouse $12 $16 $24 13 18 19 15 17 23 17 26 25 18 23 21 20 15 22 17 19 27 24 18 31 Use a = 0.05 to test whether there is a significant difference among the mean meal price for the three types of restaurants. State the null and alternative hypotheses. O Ho: ralian * lseafood * lsteakhouse H: talian = lSeafood = ASteakhouse O Ho: Not all the…arrow_forward
- Determine whether the study depicts an observational study or an experiment. A scientist was studying the effects of a new fertilizer on crop yield. She randomly assigned half of the plots on a farm to group one and the remaining plots to group two. On the plots in group one, the new fertilizer was used for a year. On the plots in group two, the old fertilizer was used. At the end of the year the average crop yield for the plots in group one was compared with the average crop yield for the plots in group two.arrow_forwardANOVA. Dr. Milgramm is conducting a patient satisfaction survey, rating how well her patients like her on a scale of 1-10. Her patients tend to fall into three categories: “Like a lot”, “like somewhat”, and “dislike a lot”. She believes that she might get different satisfaction scores from people in each group, but (because she's not great at numbers) she wants you to do an ANOVA to be sure. She has collected data from 12 patients (three equal groups) with the following results. Group 1) “Like a lot” Mean: 8 SS: 2 N: df: Group 2) “Like somewhat” Mean: 5 SS: 6 N: df: Group 3) “Dislike a lot” Mean: 2 SS: 4 N: df: Grand Mean: df Within-Group:__________ df Between-Groups:___________ Estimated Variance (S21) for Group 1: _______ Estimated Variance (S22) for Group 2: ___________ Estimated…arrow_forwardThis semester, we have talked about creating random samples as well as desirable qualities of random samples. Other than randomness, one quality of random samples that we have talked about is representation. Using your knowledge of that concept, consider this problem. At a college, 29% of the students are in their first year, 27% are in their second year, 25% in their third, and 19% in their fourth. You take a survey of students and when you classify them by year of study, you have 49, 70, 56, and 25 students in their first, second, third, and fourth years respectively. The table below highlights this information. Year of School First Second Third Fourth Total College Percents Sample Counts Expected Counts 27% 70 25% 56 29% 19% 49 25 200 58 54 50 38 Under the assumption that we think the college enrollment percentages should match our sample, and that therefore our sample represents the college: a) What would the critical value be? (use a = 0.05) b) Find the test statistic to test (c)…arrow_forward
- Suppose you were presented with the results of a study comparing two different training methods for basketball athletes. You are told 32 athletes were randomly assigned to the two groups so that 16 were in the group A and 16 were in the group B. At the end of the session, the average scores (wins versus losses) of the two groups/teams were compared and a difference of 10% was observed ( the first team had 10% more wins than the second). The coach observer reports two- sample t-test shows this difference is statistically significant. How would you interpret these findings? What questions or concerns would you have? How might this type of study be improved? Hint: Consider the possibility that the test performed was not the appropriate one.arrow_forwardThe researcher is concerned that older persons may not be knowledgeable of the COFLU-20. As such, he is interested in investigating the association between the age of the respondents and their knowledge level. Table 2 below shows the knowledge level of respondents, by age group. Table 2 (image included) Conduct a test, at the 5% level of significance, to determine whether the data provided sufficient evidence to conclude that an association exists between age group and knowledge level. State the hypotheses to be tested: H0: H1: state the degrees of freedom for this test the p-value for this test, given that the chi-square test statistic, c2, is 11.029. state the conclusion for the test. Give reason for your answer.arrow_forwardonly need help with the questions in the second picture attached.arrow_forward
- Psychologists at Disney World measured factors that affect the scariness of the soundtrack for their Haunted House ride. In particular, they were interested in the loudness of the screams (soft versus loud) and the length of the screams (short versus long). They used a 2 × 2 factorial design to test how these factors combined. They collected data from 10 different riders in each of the four conditions. Each rider rated the scariness of the ride on a nine-point scale. short screams long screams soft screams T=38, n = 10, SS = 13.6 T=64, n = 10, SS = 22.4 loud screams T=52, n=10, SS = 29.6 T=50, n=10, SS = 16.0 For these data: G = 204, N = 40, X2 = 1156. 1. Sketch a dataplot of the mean rating in each condition. 2. Calculate SS total, the total sum of squares 3. Calculate SSwithin, the within-treatments sum of squares. 4. Calculate SSbetween, the between-treatments sum of squares. 5. Calculate SSA the sum of squares for Factor A (length of scream). 6. Calculate SSB, the sum of squares…arrow_forwardTo determine the amount of sugar in a typical serving of breakfast cereal, a student randomly selected 60 boxes of different types of cereal from the shelves of a large grocery store. The student noticed that the side panels of some of the cereal boxes showed sugar content based on one-cup servings, while others showed sugar content based on three- quarter-cup servings. Many of the cereal boxes with side panels that showed three-quarter-cup servings were ones that appealed to young children, and the student wondered whether there might be some difference in the sugar content of the cereals that showed different-size servings on their side panels. To investigate the question, the data were separated into two groups. One group consisted of 29 cereals that showed one-cup serving sizes; the other group consisted of 31 cereals that showed three-quarter cup serving sizes. The boxplots shown below display sugar content (in grams) per serving of the cereals for each of the two serving sizes.…arrow_forwardBelow you will find a research scenarios. Your task is to identify the proposed analysis and why you chose that analysis for each of these scenarios. State the research question that aligns with the scenario and the analysis. Next run the appropriate analyses and report your findings in APA Research scenario 2: Historians are interested in the accuracy of eyewitness accounts of traumatic events. One study examined survivors' recall of the sinking of the ship Titanic (Riniolo, Koledin, Drakulic, & Payne, 2003). The researchers reviewed the transcripts of survivors' testimony at governmental hearings (www.titanicinquiry.org) to see whether they testified that the ship was intact or breaking apart during the ship's final plunge (it was in fact breaking apart). To test for eyewitness accuracy, testimony of 20 survivors was examined to see if there was an equal likelihood of survivors saying the ship was intact or breaking apart. Datafile: titanic.xlsx Your response should contain…arrow_forward
arrow_back_ios
arrow_forward_ios
Recommended textbooks for you
 A First Course in Probability (10th Edition)ProbabilityISBN:9780134753119Author:Sheldon RossPublisher:PEARSON

A First Course in Probability (10th Edition)
Probability
ISBN:9780134753119
Author:Sheldon Ross
Publisher:PEARSON
