
MATLAB: An Introduction with Applications
6th Edition
ISBN: 9781119256830
Author: Amos Gilat
Publisher: John Wiley & Sons Inc
expand_more
expand_more
format_list_bulleted
Related questions
Topic Video
Question
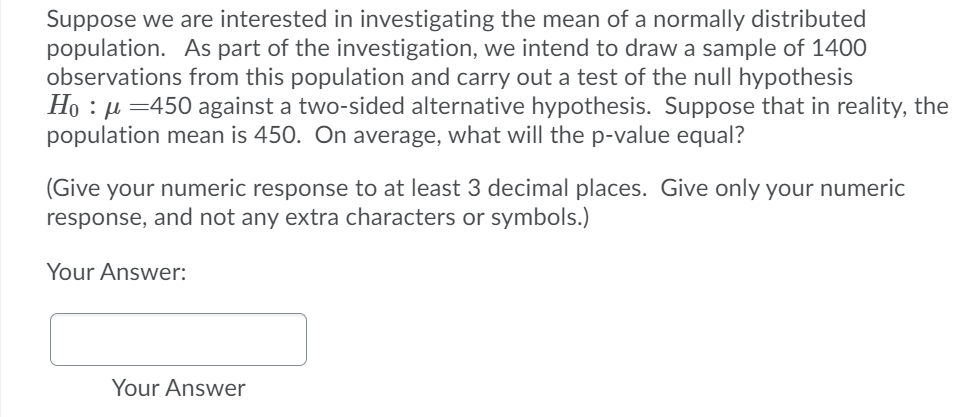

Transcribed Image Text:Suppose we are interested in investigating the mean of a normally distributed
population. As part of the investigation, we intend to draw a sample of 1400
observations from this population and carry out a test of the null hypothesis
Ho : µ =450 against a two-sided alternative hypothesis. Suppose that in reality, the
population mean is 450. On average, what will the p-value equal?
(Give your numeric response to at least 3 decimal places. Give only your numeric
response, and not any extra characters or symbols.)
Your Answer:
Your Answer
Expert Solution
This question has been solved!
Explore an expertly crafted, step-by-step solution for a thorough understanding of key concepts.

Step by stepSolved in 2 steps

Knowledge Booster


Learn more about
Need a deep-dive on the concept behind this application? Look no further. Learn more about this topic, statistics and related others by exploring similar questions and additional content below.Similar questions
- Suppose the study described in the previous question was conducted by a colleague. He tells you that based on a chi-square distribution with 2 degrees of freedom, his p-value was 0.11, and he concludes that the proportions are not the same across health status categories. Do you agree with his conclusion? Yes, by rejecting the null hypothesis, it does appear that the proportions are not the same. Yes. He should have not rejected the null hypothesis and concluded that they do not appear to be related. Yes. a p-value > 0.05 always indicates that variables are related regardless of the test conductedarrow_forwardA nutritionist wants to investigate whether her new diet will be effective in helping women aged 30-40 to lose weight. She will use a paired sample to determine whether the mean weight of women before going on this diet is greater than the mean weight of women after being on this diet for two months. Determine the null and alternative hypotheses for the proposed hypothesis test. O A. Let μ₁ denote the mean weight of women before going on this diet and let μ₂ denote the mean weight of women who have been on this diet for two months. The null and alternative hypotheses are Ho: H₁ H2 and Ha: H₁ H₂. O D. Let μ₁ denote the mean weight of women before going on this diet and let μ₂ denote the mean weight of women who have been on this diet for two months. The null and alternative hypotheses are Ho: H₁ H2 and Ha: H₁ H₂.arrow_forwardAccording to a University Center for Logistics Management, 12% of all merchandise sold in the United States gets returned. A Seattle department store sampled 89 items sold in January and found that 8 of the items were returned.If you have the following null and alternative hypotheses for a test you are running:H0:p=0.12Ha:p<0.12Calculate the test statistic, rounded to 3 decimal places Z=arrow_forward
- Two separate samples are selected from the same population. Each have an n=8. Both samples receive a different treatment. After the treatment, the first sample has SS=16 and the second sample has SS=24. With a mean of 3 for the first group and mean of 6 for the second group, compute the t statistic. State the conclusion of these findings.arrow_forward16% of all Americans suffer from sleep apnea. A researcher suspects that a different percentage of those who live in the inner city have sleep apnea. Of the 337 people from the inner city surveyed, 47 of them suffered from sleep apnea. What can be concluded at the level of significance of α= 0.05? a. The test statistic= (please show your answer to 3 decimal places.) b. The p-value = (Please show your answer to 4 decimal places.)arrow_forwardSelect the most appropriate response. It is claimed that the mean age of bus drivers in Chicago is 59.3 years. If a hypothesis test is performed, how should you interpret a decision that fails to reject the null hypothesis? Question 2 options: There is not sufficient evidence to reject the claim µ = 59.3. There is sufficient evidence to reject the claim p = 59.3. There is not sufficient evidence to support the claim p = 59.3. There is sufficient evidence to support the claim u = 59.3.arrow_forward
- Bags of a certain brand of tortilla chips claim to have a net weight of 14 oz. Net weights actually vary slightly from bag to bag and are Normally distributed with mean u. A representative of a consumer advocate group wishes to see if there is any evidence that the mean net weight is less than advertised, so he intends to test the hypotheses Ho: μ = 14, Ha: μ < 14. To do this, he selects 16 bags of this brand at random and determines the net weight of each. He finds the sample mean to be x = 13.88 and the sample standard deviation to be s = 0.24. Suppose in a similar test of 16 bags of these tortilla chips the P-value is 0.001. Further suppose that a is chosen to be 0.001. In that case, we would conclude that: Othere is not significant evidence that the mean net weight of the bags of chips is less than the advertised 14 oz. O there is not significant evidence that the mean net weight of the bags of chips is not less than the advertised 14 oz. O there is significant evidence that the…arrow_forwardUnder what circumstances is a t statistic used instead of a z-score for a hypothesis test? Justin wants to know whether a commonly prescribed drug does improve the attention span of students with attention deficit disorder (ADD). He knows that the mean attention span for students with ADD who are not taking the drug is 2.3 minutes long. His sample of 12 students taking the drug yielded a mean of 4.6 minutes. Justin can find no information regarding σx , so he calculated s2x =1.96. Determine the critical region using a one-tailed test with alpha = .05. Conduct the hypothesis test (Do the math and compare the t-critical and t-obtained values). State your conclusions in terms of H0 (Should you reject the H0 or fail to reject/accept the H0). Based on your analysis, is there a relationship between the drug and attention span?arrow_forwardSuppose that having a widow's peak was a dominant trait (W) compared to not having a widow's peak (w). In a sample size of 30 students, 15 were observed to have a widow's peak and 15 did not have a widow's peak. The expected frequency of a widow's peak is 75% chance of getting it and a 25% chance of not getting it. Perform a chi square analysis to see if the data above agrees with the predicted outcome.arrow_forward
arrow_back_ios
arrow_forward_ios
Recommended textbooks for you
- MATLAB: An Introduction with ApplicationsStatisticsISBN:9781119256830Author:Amos GilatPublisher:John Wiley & Sons Inc
 Probability and Statistics for Engineering and th...StatisticsISBN:9781305251809Author:Jay L. DevorePublisher:Cengage Learning
 Statistics for The Behavioral Sciences (MindTap C...StatisticsISBN:9781305504912Author:Frederick J Gravetter, Larry B. WallnauPublisher:Cengage Learning
  Elementary Statistics: Picturing the World (7th E...StatisticsISBN:9780134683416Author:Ron Larson, Betsy FarberPublisher:PEARSON
 The Basic Practice of StatisticsStatisticsISBN:9781319042578Author:David S. Moore, William I. Notz, Michael A. FlignerPublisher:W. H. Freeman
 Introduction to the Practice of StatisticsStatisticsISBN:9781319013387Author:David S. Moore, George P. McCabe, Bruce A. CraigPublisher:W. H. Freeman
MATLAB: An Introduction with Applications
Statistics
ISBN:9781119256830
Author:Amos Gilat
Publisher:John Wiley & Sons Inc
Probability and Statistics for Engineering and th...
Statistics
ISBN:9781305251809
Author:Jay L. Devore
Publisher:Cengage Learning
Statistics for The Behavioral Sciences (MindTap C...
Statistics
ISBN:9781305504912
Author:Frederick J Gravetter, Larry B. Wallnau
Publisher:Cengage Learning
Elementary Statistics: Picturing the World (7th E...
Statistics
ISBN:9780134683416
Author:Ron Larson, Betsy Farber
Publisher:PEARSON
The Basic Practice of Statistics
Statistics
ISBN:9781319042578
Author:David S. Moore, William I. Notz, Michael A. Fligner
Publisher:W. H. Freeman
Introduction to the Practice of Statistics
Statistics
ISBN:9781319013387
Author:David S. Moore, George P. McCabe, Bruce A. Craig
Publisher:W. H. Freeman