
MATLAB: An Introduction with Applications
6th Edition
ISBN: 9781119256830
Author: Amos Gilat
Publisher: John Wiley & Sons Inc
expand_more
expand_more
format_list_bulleted
Related questions
Concept explainers
Question
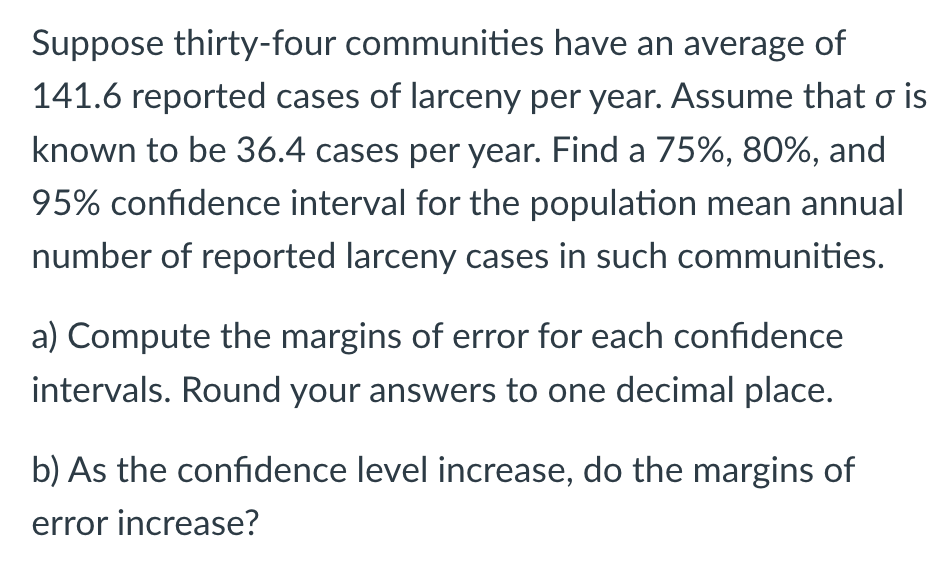

Transcribed Image Text:Suppose thirty-four communities have an average of
141.6 reported cases of larceny per year. Assume that o is
known to be 36.4 cases per year. Find a 75%, 80%, and
95% confidence interval for the population mean annual
number of reported larceny cases in such communities.
a) Compute the margins of error for each confidence
intervals. Round your answers to one decimal place.
b) As the confidence level increase, do the margins of
error increase?
Expert Solution
This question has been solved!
Explore an expertly crafted, step-by-step solution for a thorough understanding of key concepts.

This is a popular solution

Trending nowThis is a popular solution!

Step by stepSolved in 3 steps

Knowledge Booster


Learn more about
Need a deep-dive on the concept behind this application? Look no further. Learn more about this topic, statistics and related others by exploring similar questions and additional content below.Similar questions
- You are interested in constructing a 95% confidence interval for the proportion of all caterpillars that eventually become butterflies. Of the 437 randomly selected caterpillars observed, 59 lived to become butterflies. Round answers to 4 decimal places where possible. a. With 95% confidence the proportion of all caterpillars that lived to become a butterfly is between and b. If many groups of 437 randomly selected caterpillars were observed, then a different confidence interval would be produced from each group. About percent of these confidence intervals will contain the true population proportion of caterpillars that become percent will not contain the true population proportion. butterflies and about se Submit Question IN ch ins prt sc delete f6 te 144 పాలంంక్ & 7 $4 00 %24arrow_forwardIf n=28, ¯x(x-bar)=32, and s=11, construct a confidence interval at a 95% confidence level. Assume the data came from a normally distributed population.Give your answers to one decimal place.arrow_forwardYou are interested in constructing a 99% confidence interval for the proportion of all caterpillars that eventually become butterflies. Of the 381 randomly selected caterpillars observed, 42 lived to become butterflies. Round answers to 4 decimal places where possible. a. With 99% confidence the proportion of all caterpillars that lived to become a butterfly is between and b. If many groups of 381 randomly selected caterpillars were observed, then a different confidence interval would be produced from each group. About percent of these confidence intervals will contain the true population proportion of caterpillars that become butterflies and about percent will not contain the true population proportion.arrow_forward
- IF n=23, x-bar = 39, and s=3, find the margin of error at a 80% confidence level. Give answer to two decimal places.arrow_forwardYou are interested in constructing a 90% confidence interval for the proportion of all caterpillars that eventually become butterflies. Of the 377 randomly selected caterpillars observed, 42 lived to become butterflies. Round answers to 4 decimal places where possible. a. With 90% confidence the proportion of all caterpillars that lived to become a butterfly is between and b. If many groups of 377 randomly selected caterpillars were observed, then a different confidence interval would be produced from each group. About percent of these confidence intervals will contain the true population proportion of caterpillars that become butterflies and about percent will not contain the true population proportion.arrow_forwardIf n=15, ¯xx¯(x-bar)=39, and s=11, construct a confidence interval at a 95% confidence level. Assume the data came from a normally distributed population.Give your answers to one decimal place.arrow_forward
- If n=29, x¯(x-bar)=31, and s=8, construct a confidence interval at a 90% confidence level. Assume the data came from a normally distributed population.Give your answers to one decimal place.arrow_forwardWhen a population has less variability, for the same margin of error and confidence level, the confidence interval becomes a. larger b. smaller c. of unchanged sizearrow_forwardif n=20, x=43, and s=9, construct a confidence interval at a 98% confidence level, the data came from a normally distributed population.arrow_forward
- You are interested in constructing a 90% confidence interval for the proportion of all caterpillars that eventually become butterflies. Of the 384 randomly selected caterpillars observed, 46 lived to become butterflies. Round answers to 4 decimal places where possible. a. With 90% confidence the proportion of all caterpillars that lived to become a butterfly is between and b. If many groups of 384 randomly selected caterpillars were observed, then a different confidence interval would be produced from each group. About percent of these confidence intervals will contain the true population proportion of caterpillars that become butterflies and about percent will not contain the true population proportion.arrow_forwardThrough polling, it was estimated that the percent of people who will vote for a particular candidate in an upcoming election is 36.2%. If the margin of error is 3.5, give the confidence interval for the percentage of people who will vote for the candidate in the upcoming election.% to %arrow_forwardsuppose that you take 1000 simple random samples from a population and that, for each sample, you obtain a 95% confidence interval for an unknown parameter. Approximately how many of those confidence intervals will continue the value of the unknown parameter?arrow_forward
arrow_back_ios
SEE MORE QUESTIONS
arrow_forward_ios
Recommended textbooks for you
- MATLAB: An Introduction with ApplicationsStatisticsISBN:9781119256830Author:Amos GilatPublisher:John Wiley & Sons Inc
 Probability and Statistics for Engineering and th...StatisticsISBN:9781305251809Author:Jay L. DevorePublisher:Cengage Learning
 Statistics for The Behavioral Sciences (MindTap C...StatisticsISBN:9781305504912Author:Frederick J Gravetter, Larry B. WallnauPublisher:Cengage Learning
  Elementary Statistics: Picturing the World (7th E...StatisticsISBN:9780134683416Author:Ron Larson, Betsy FarberPublisher:PEARSON
 The Basic Practice of StatisticsStatisticsISBN:9781319042578Author:David S. Moore, William I. Notz, Michael A. FlignerPublisher:W. H. Freeman
 Introduction to the Practice of StatisticsStatisticsISBN:9781319013387Author:David S. Moore, George P. McCabe, Bruce A. CraigPublisher:W. H. Freeman
MATLAB: An Introduction with Applications
Statistics
ISBN:9781119256830
Author:Amos Gilat
Publisher:John Wiley & Sons Inc
Probability and Statistics for Engineering and th...
Statistics
ISBN:9781305251809
Author:Jay L. Devore
Publisher:Cengage Learning
Statistics for The Behavioral Sciences (MindTap C...
Statistics
ISBN:9781305504912
Author:Frederick J Gravetter, Larry B. Wallnau
Publisher:Cengage Learning
Elementary Statistics: Picturing the World (7th E...
Statistics
ISBN:9780134683416
Author:Ron Larson, Betsy Farber
Publisher:PEARSON
The Basic Practice of Statistics
Statistics
ISBN:9781319042578
Author:David S. Moore, William I. Notz, Michael A. Fligner
Publisher:W. H. Freeman
Introduction to the Practice of Statistics
Statistics
ISBN:9781319013387
Author:David S. Moore, George P. McCabe, Bruce A. Craig
Publisher:W. H. Freeman