
MATLAB: An Introduction with Applications
6th Edition
ISBN: 9781119256830
Author: Amos Gilat
Publisher: John Wiley & Sons Inc
expand_more
expand_more
format_list_bulleted
Related questions
Topic Video
Question
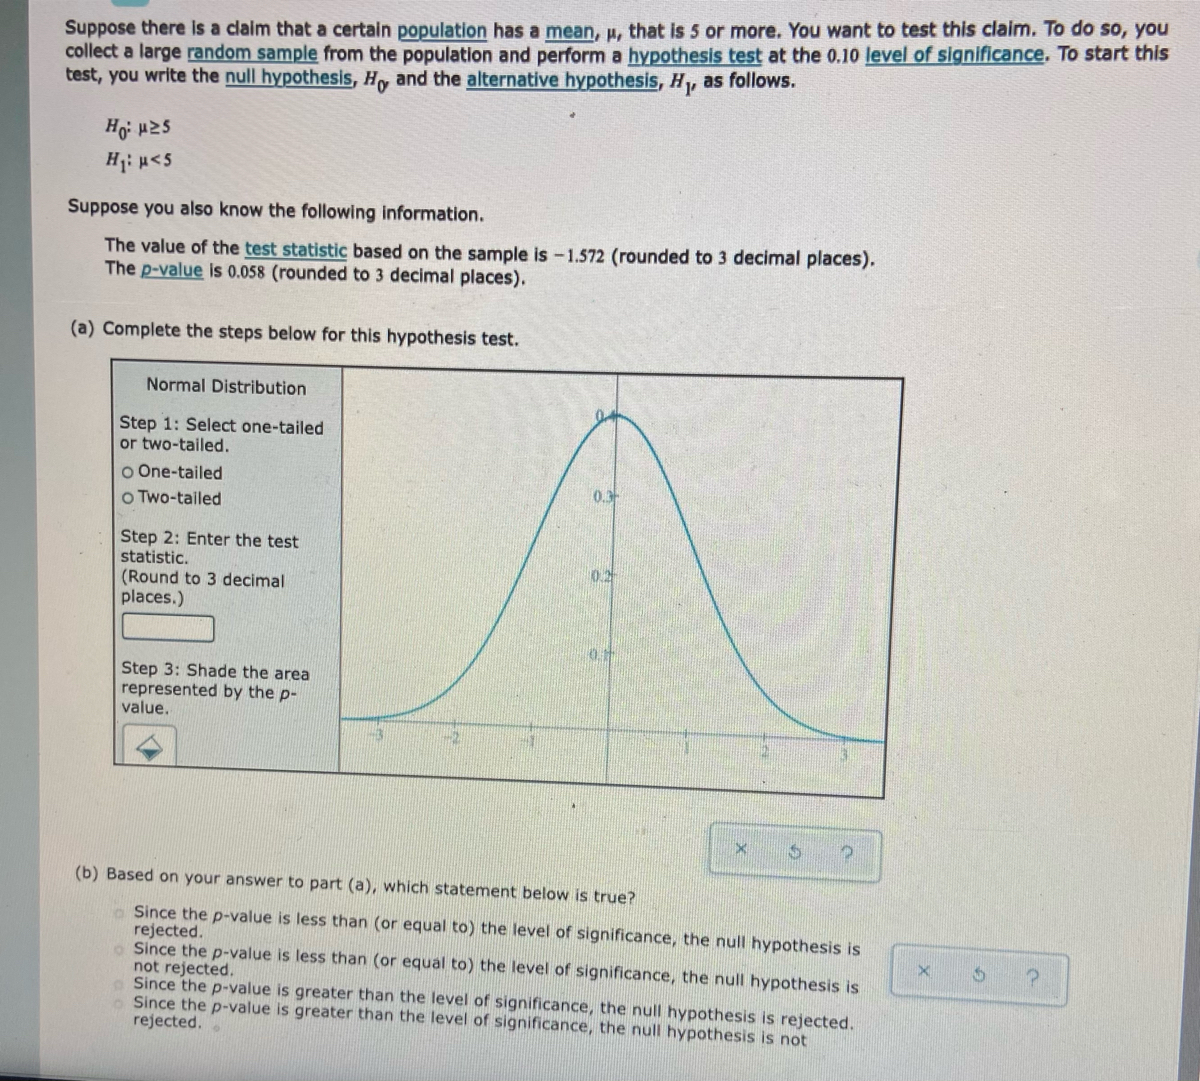

Transcribed Image Text:Suppose there is a claim that a certain population has a mean, p, that is 5 or more. You want to test this claim. To do so, you
collect a large random sample from the population and perform a hypothesis test at the 0.10 level of significance. To start this
test, you write the null hypothesis, Hy and the alternative hypothesis, H, as follows.
H: u<5
Suppose you also know the following information.
The value of the test statistic based on the sample is -1.572 (rounded to 3 decimal places).
The p-value is 0.058 (rounded to 3 decimal places).
(a) Complete the steps below for this hypothesis test.
Normal Distribution
Step 1: Select one-tailed
or two-tailed.
o One-tailed
O Two-tailed
0.3
Step 2: Enter the test
statistic.
02
(Round to 3 decimal
places.)
Step 3: Shade the area
represented by the p-
value.
(b) Based on your answer to part (a), which statement below is true?
Since the p-value is less than (or equal to) the level of significance, the null hypothesis is
rejected.
Since the p-value is less than (or equal to) the level of significance, the null hypothesis is
not rejected.
Since the p-value is greater than the level of significance, the null hypothesis is rejected.
Since the p-value is greater than the level of significance, the null hypothesis is not
rejected.
Expert Solution
This question has been solved!
Explore an expertly crafted, step-by-step solution for a thorough understanding of key concepts.

This is a popular solution

Trending nowThis is a popular solution!

Step by stepSolved in 2 steps with 1 images

Knowledge Booster


Learn more about
Need a deep-dive on the concept behind this application? Look no further. Learn more about this topic, statistics and related others by exploring similar questions and additional content below.Similar questions
- The first test a doctor would order to determine whether a person is infected with HIV (the virus that causes AIDS) is the ELISA test. It detects antibodies and antigens for HIV. A study in Statistical Science by J. Gastwirth estimated that, if the person is actually infected with HIV, this test produces a positive result 97.7% of the time. If a person is not infected with HIV, the test result is negative 92.6% of the time. According the the US Centers for Disease Control (CDC), an estimated 1.1 million Americans out of a population of 321 million were infected with HIV in 2015. Using the information above, determine the probability that a randomly selected person whose ELISA test is positive actually is infected with HIV? a. What is the probability that a randomly selected American is infected with HIV? b. Using the answer to part (a) and the conditional probabilities of positive and negative ELISA test results, fill out the contingency table below: ELISA Test Result…arrow_forwardQuestion 6 In this exercise, we are conducting many hypothesis tests to test a claim. Assume that the null hypothesis is true. If 100 tests are conducted using a significance level of 5%, approximately how many of the tests will incorrectly find significance?Enter your answer in accordance to the question statement of the tests will find significance.arrow_forward22. See photoarrow_forward
- Suppose you are asked to conduct a two-tailed hypothesis test on the population mean. What type of hypothesis test would you use? Why? What assumptions do you need to make about the process when you are conducting a hypothesis test on the population mean in order for your results to be valid?arrow_forwardi need to know how to solve thisarrow_forwardA marketing agency wanted to determine if a new commercial changed people's opinion about a company. They recruited n=30 participants to watch the commercial. First, everyone was givien a survey to determine their attitudes toward the company. Then, everyone watched the new commercial. Finally, they were given the same survey again and asked about their attitudes toward the comapny after seeing the commercial. The agency wanted to see if attitudes were changed by the commercial. What statistical test should they use?arrow_forward
- PART d earrow_forwardThis procedure enables us to decide with the statistical hypothesis. a.Statistical hypothesis b.Level of confidence c.Test of the hypothesis d.Null hypothesis choose the best answer thank you so mucharrow_forwardSuppose you conduct a hypothesis test based on a sample where the sample size is n = 50, and arrive at a p-value of 0.08. You then refer back to your notes and discover that you made a careless mistake, the sample size should have been n = 500. Will your p-value increase, decrease, or stay the same? stay the same increase decrease Answer not herearrow_forward
- An ANOVA test is conducted of the grades earned by students from a math professor, who taught 3 sections of the same class: morning, afternoon and evening. The decision was to Reject the null hypothesis. Does the test tell which mean is significantly different? yes O noarrow_forwardA college counselor wants to perform the hypothesis test H0 : p = 0.50, Ha: p > 0.50, where p is the proportion of undergraduate students who eat breakfast. In a sample of 446 students, 246 ate breakfast. What is the P-value for this hypothesis test? a .0147 b .9853 c .552 d .448arrow_forwardSuppose are running a study/poll about the accuracy rate for fingerprint identification. You randomly sample 127 people and find that 89 of them match the condition you are testing. Suppose you are have the following null and alternative hypotheses for a test you are running: Ho: p = 0.72 H₁: p 0.72 Calculate the test statistic, rounded to 3 decimal places Question Help: Video Message instructor Post to forum Submit Questionarrow_forward
arrow_back_ios
SEE MORE QUESTIONS
arrow_forward_ios
Recommended textbooks for you
- MATLAB: An Introduction with ApplicationsStatisticsISBN:9781119256830Author:Amos GilatPublisher:John Wiley & Sons Inc
 Probability and Statistics for Engineering and th...StatisticsISBN:9781305251809Author:Jay L. DevorePublisher:Cengage Learning
 Statistics for The Behavioral Sciences (MindTap C...StatisticsISBN:9781305504912Author:Frederick J Gravetter, Larry B. WallnauPublisher:Cengage Learning
  Elementary Statistics: Picturing the World (7th E...StatisticsISBN:9780134683416Author:Ron Larson, Betsy FarberPublisher:PEARSON
 The Basic Practice of StatisticsStatisticsISBN:9781319042578Author:David S. Moore, William I. Notz, Michael A. FlignerPublisher:W. H. Freeman
 Introduction to the Practice of StatisticsStatisticsISBN:9781319013387Author:David S. Moore, George P. McCabe, Bruce A. CraigPublisher:W. H. Freeman
MATLAB: An Introduction with Applications
Statistics
ISBN:9781119256830
Author:Amos Gilat
Publisher:John Wiley & Sons Inc
Probability and Statistics for Engineering and th...
Statistics
ISBN:9781305251809
Author:Jay L. Devore
Publisher:Cengage Learning
Statistics for The Behavioral Sciences (MindTap C...
Statistics
ISBN:9781305504912
Author:Frederick J Gravetter, Larry B. Wallnau
Publisher:Cengage Learning
Elementary Statistics: Picturing the World (7th E...
Statistics
ISBN:9780134683416
Author:Ron Larson, Betsy Farber
Publisher:PEARSON
The Basic Practice of Statistics
Statistics
ISBN:9781319042578
Author:David S. Moore, William I. Notz, Michael A. Fligner
Publisher:W. H. Freeman
Introduction to the Practice of Statistics
Statistics
ISBN:9781319013387
Author:David S. Moore, George P. McCabe, Bruce A. Craig
Publisher:W. H. Freeman