
ENGR.ECONOMIC ANALYSIS
14th Edition
ISBN: 9780190931919
Author: NEWNAN
Publisher: Oxford University Press
expand_more
expand_more
format_list_bulleted
Related questions
Concept explainers
Question
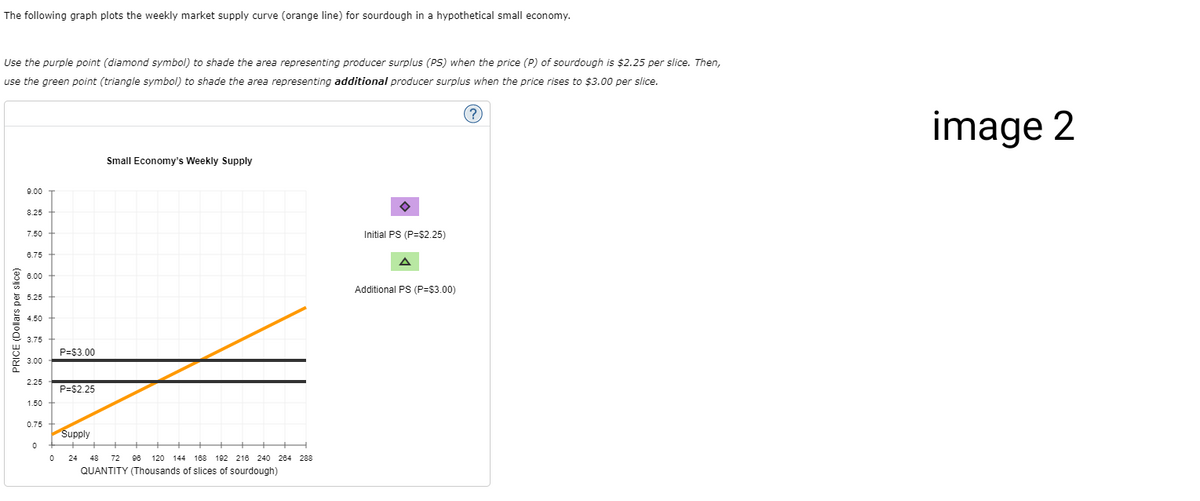

Transcribed Image Text:The following graph plots the weekly market supply curve (orange line) for sourdough in a hypothetical small economy.
Use the purple point (diamond symbol) to shade the area representing producer surplus (PS) when the price (P) of sourdough is $2.25 per slice. Then,
use the green point (triangle symbol) to shade the area representing additional producer surplus when the price rises to $3.00 per slice.
(?)
PRICE (Dollars per slice)
9.00
8.25
7.50
6.75
6.00
5.25
4.50
3.75 +
3.00
2.25
1.50
0.75
0
0
P=$3.00
P=$2.25
Supply
Small Economy's Weekly Supply
24 48 72 96 120
120 144
144 168 192 216 240 284 288
QUANTITY (Thousands of slices of sourdough)
Initial PS (P=$2.25)
A
Additional PS (P=$3.00)
image 2

Transcribed Image Text:Suppose the market for sourdough is perfectly competitive, so sellers take the market price as given. Darnell manages a restaurant that offers
sourdough for sale. The following graph plots Darnell's weekly supply curve (orange line). Point A represents a point along his supply curve. The price
of sourdough is $2.25 per slice, which is given by the black horizontal line.
PRICE (Dollars per slice)
9.00
8.25
7.50
6.75
6.00
5.25
4.50
3.75
3.00
2.25
1.50
0.75
Price
Supply
0 2 4
XXX
Darnell's Weekly Supply
6
A
8 10 12 14 16 18
QUANTITY (Slices of sourdough)
20
22 24
?
Using the previous graph, you can determine that Darnell is willing to supply his 6th weekly slice of sourdough for $
$2.25 per slice, the producer surplus earned from supplying the 6th slice of sourdough is $
Since he receives
Suppose the price of sourdough were to rise to $3.00 per slice. At this higher price, Darnell would receive a producer surplus of $
6th slice of sourdough he sells.
The following graph plots the weekly market supply curve (orange line) for sourdough in a hypothetical small economy.
from the
image 1
Expert Solution
This question has been solved!
Explore an expertly crafted, step-by-step solution for a thorough understanding of key concepts.

This is a popular solution

Trending nowThis is a popular solution!

Step by stepSolved in 4 steps with 2 images

Knowledge Booster


Learn more about
Need a deep-dive on the concept behind this application? Look no further. Learn more about this topic, economics and related others by exploring similar questions and additional content below.Similar questions
- In 1985, International Data Corporation (IDC) estimated that 3.7 million desktop computers had been sold at an average price of $1,054. In 2000, the number sold in the United States had risen to 132 million, with the average price decreasing to $700. The change in individuals’ tastes and preferences has increased their demand for computers. Explain how the price of computers dropped over the 15-year period from 1985 to 2000.arrow_forwardIn the following scenarios, you will be given a product and an event. Determine what will happen to the demand for the product based on the event, what happens to the demand curve, and give the non-price determinant that caused it to occur. (chose from the 7 determinants listed in the notes). The first one is answered for you as an example. EXAMPLE/ Product - Hamburgers Event - The price of steak increases Answer/ Demand increases - Curve shifts right - Price of substitutes 1. Pepsi - The price of Coke decreases dramatically. 2. Steak - Incomes fall due to the recession 3. Hair dye - Hair dye is successfully advertised in the media. 4. Computer software - The price of computers goes down.arrow_forwardTom had an "absolute need" for web help and therefore was ready to "pay anything" to get it. If this were true, what shape would his demand curve have? Why isn't this realistic?arrow_forward
- The table below provides price and output information for Angela's weekly demand curve for cheeseburgers. Use the information in the table to answer the questions below, and give all answers to two decimals. Price (per cheeseburger) $12 $9 Number of Cheeseburgers Demanded (per week) 2 4 a. Calculate the price elasticity of demand (at $12) if the price falls from $12 to $9. b. Calculate the price elasticity of demand (at $9) if the price increases from $9 to $12. c. Calculate the price elasticity of demand (using the midpoint method) between $9 and $12.arrow_forwardImagine you are bundling popcorn, soda and candy for AMC Theaters. You have the following data on your customers. Assume 1 of each customer type. For simplicity, assume the price of each good is zero (so really maximizing revenue). Customer Type 1 Customer Type 2 Customer Type 3 Popcorn $6 $5 $7 Candy $7 $6 $5 Soda $5 $7 $6 (a) If you had to sell each product separately, what would you price them at to maximize profits? (b) If you had an option to bundle the 3 products together (a pure bundle option instead of selling separately), what would you price the bundle at? (c) How much would this increase or decrease profits by?arrow_forward[Related to Solved Problem #1] You own a hot dog stand that you set up outside the student union every day at lunch time. Currently, you are selling hot dogs for a price of $3, and you sell 30 hot dogs a day (point A on the diagram to the right). You are considering cutting the price to $2. The graph to the right shows two possible increases in the quantity sold as a result of your price cut. Use the information in the graph (new quantities are given on the horizontal axis) to calculate the price elasticity between these two prices on each of the demand curves. Use the midpoint formula to calculate the price elasticities. On the demand curve containing the points "A" and "B", the price elasticity of demand for a price cut from $3 to $2 is. (Hint: Include the negative sign and enter your response rounded to two decimal places.) On the demand curve containing the points "A" and "C", the price elasticity of demand for a price cut from $3 to $2 is. (Hint: Include the negative sign and…arrow_forward
- QUESTION 9 9. Imagine a small bakery that produces two types of bread: Whole Wheat Bread (Good A) and White Bread (Good B). Both of these bread types require similar production processes and are considered substitutes in production. The bakery has been operating in a stable market until recently. The demand for Good A (Whole Wheat Bread) increases due to a health trend that promotes whole wheat products. As a result, the increase in demand for Good A shift the a) demand curve for good B rightward. b) demand curve for good B leftward. c) supply curve of good B rightward. d) supply curve of good B leftward. (4arrow_forwardSuppose that Tim and Alyssa are the only consumers of pizza slices in a particular market. The following table shows their annual demand schedules:arrow_forwardEdison's Fire Engines is the sole seller of fire engines in the fictional country of Pyrotania. Initially, Edison produced eight fire engines, but he has decided to increase production to nine fire engines. The following graph shows the demand curve Edison faces. As you can see, to sell the additional engine, Edison must lower his price from $80,000 to $60,000 per fire engine. Note that while Edison gains revenue from the additional engine he sells, he also loses revenue from the initial eight engines because he sells them all at the lower price. Use the purple rectangle (diamond symbols) to shade the area representing the revenue lost from the initial eight engines by selling at $60,000 rather than $80,000. Then use the green rectangle (triangle symbols) to shade the area representing the revenue gained from selling an additional engine at $60,000. 100 90 PRICE (Thousands of dollars per fire engine) 8 80 70 60 50 40 30 10 0 Edison 0 1 O True 2 O False + 6 3 4 5 7 QUANTITY (Fire…arrow_forward
- PRICE (Dollars per cup) Suppose that Brian and Crystal are the only suppliers of iced lattes in some hypothetical market. Their monthly supply schedules are given by the following table: Price (Dollars per cup) Brian's Quantity Supplied Crystal's Quantity Supplied (Cups) (Cups) 1 0 3 2 4 6 3 6 8 4 7 10 5 8 11 On the following graph, plot Brian's supply of iced lattes using the green points (triangle symbol). Next, plot Crystal's supply of iced lattes using the purple points (diamond symbol). Finally, plot the market supply of iced lattes using the orange points (square symbol). Note: Line segments will automatically connect the points. Remember to plot from left to right. 5 0 0 4 8 12 16 20 24 QUANTITY (Cups) Brian's Supply Crystal's Supply --- Market Supplyarrow_forwardConsider the market for ice cream cones. Suppose that supply in this market is given by PS = Q$ and demand is given by PD = 30 – 4 × QD. Answer the following questions. Notice that the competitive equilibrium (Qº,Pe) and the point (Q%,Pº) are both on the demand curve. Use them to compute the price elasticity of demand.arrow_forwardSam's Fire Engines is the sole seller of fire engines in the fictional country of Pyrotania. Initially, Sam produced seven fire engines, but he has decided to increase production to eight fire engines. The following graph shows the demand curve Sam faces. As you can see, to sell the additional engine, Sam must lower his price from $100,000 to $50,000 per fire engine. Note that while Sam gains revenue from the additional engine he sells, he also loses revenue from the initial seven engines because he sells them all at the lower price. Use the purple rectangle (diamond symbols) to shade the area representing the revenue lost from the initial seven engines by selling at $50,000 rather than $100,000. Then use the green rectangle (triangle symbols) to shade the area representing the revenue gained from selling an additional engine at $50,000. 250 225 Revenue Lost 200 175 150 Revenue Gained 125 Demand 100 75 50 25 + 1 2 3 4 5 6 7 8 10 QUANTITY (Fire engines) PRICE (Thousands of dollars per…arrow_forward
arrow_back_ios
SEE MORE QUESTIONS
arrow_forward_ios
Recommended textbooks for you
 Principles of Economics (12th Edition)EconomicsISBN:9780134078779Author:Karl E. Case, Ray C. Fair, Sharon E. OsterPublisher:PEARSON
 Engineering Economy (17th Edition)EconomicsISBN:9780134870069Author:William G. Sullivan, Elin M. Wicks, C. Patrick KoellingPublisher:PEARSON
 Principles of Economics (MindTap Course List)EconomicsISBN:9781305585126Author:N. Gregory MankiwPublisher:Cengage Learning
 Managerial Economics: A Problem Solving ApproachEconomicsISBN:9781337106665Author:Luke M. Froeb, Brian T. McCann, Michael R. Ward, Mike ShorPublisher:Cengage Learning
 Managerial Economics & Business Strategy (Mcgraw-...EconomicsISBN:9781259290619Author:Michael Baye, Jeff PrincePublisher:McGraw-Hill Education
Principles of Economics (12th Edition)
Economics
ISBN:9780134078779
Author:Karl E. Case, Ray C. Fair, Sharon E. Oster
Publisher:PEARSON
Engineering Economy (17th Edition)
Economics
ISBN:9780134870069
Author:William G. Sullivan, Elin M. Wicks, C. Patrick Koelling
Publisher:PEARSON
Principles of Economics (MindTap Course List)
Economics
ISBN:9781305585126
Author:N. Gregory Mankiw
Publisher:Cengage Learning
Managerial Economics: A Problem Solving Approach
Economics
ISBN:9781337106665
Author:Luke M. Froeb, Brian T. McCann, Michael R. Ward, Mike Shor
Publisher:Cengage Learning
Managerial Economics & Business Strategy (Mcgraw-...
Economics
ISBN:9781259290619
Author:Michael Baye, Jeff Prince
Publisher:McGraw-Hill Education