
ENGR.ECONOMIC ANALYSIS
14th Edition
ISBN: 9780190931919
Author: NEWNAN
Publisher: Oxford University Press
expand_more
expand_more
format_list_bulleted
Related questions
Question
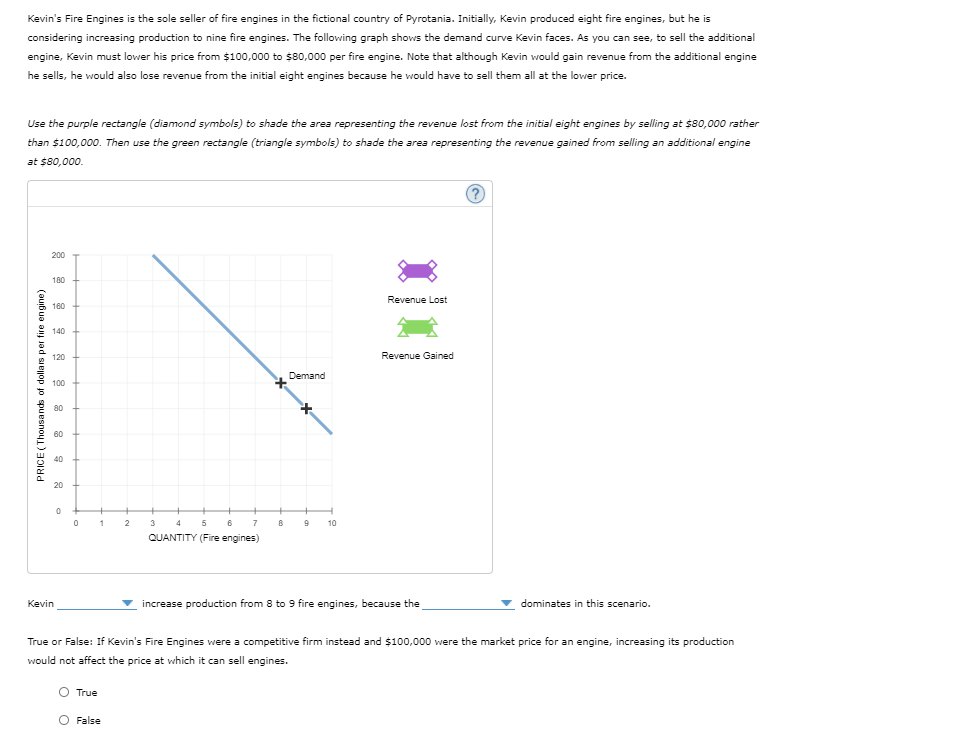

Transcribed Image Text:Kevin's Fire Engines is the sole seller of fire engines in the fictional country of Pyrotania. Initially, Kevin produced eight fire engines, but he is
considering increasing production to nine fire engines. The following graph shows the demand curve Kevin faces. As you can see, to sell the additional
engine, Kevin must lower his price from $100,000 to $80,000 per fire engine. Note that although Kevin would gain revenue from the additional engine
he sells, he would also lose revenue from the initial eight engines because he would have to sell them all at the lower price.
Use the purple rectangle (diamond symbols) to shade the area representing the revenue lost from the initial eight engines by selling at $80,000 rather
than $100,000. Then use the green rectangle (triangle symbols) to shade the area representing the revenue gained from selling an additional engine
at $80,000.
200
180
Revenue Lost
160
140
120
Revenue Gained
Demand
100
80
60
40
20
3 4 5 6
QUANTITY (Fire engines)
7
9
10
Kevin
increase production from 8 to 9 fire engines, because the
dominates in this scenario.
True or False: If Kevin's Fire Engines were a competitive firm instead and $100,000 were the market price for an engine, increasing its production
would not affect the price at which it can sell engines.
True
False
PRICE (Thousands of dollars per fire engine)
Expert Solution
This question has been solved!
Explore an expertly crafted, step-by-step solution for a thorough understanding of key concepts.

This is a popular solution

Trending nowThis is a popular solution!

Step by stepSolved in 2 steps with 1 images

Knowledge Booster


Learn more about
Need a deep-dive on the concept behind this application? Look no further. Learn more about this topic, economics and related others by exploring similar questions and additional content below.Similar questions
- Edison's Fire Engines is the sole seller of fire engines in the fictional country of Pyrotania. Initially, Edison produced eight fire engines, but he has decided to increase production to nine fire engines. The following graph shows the demand curve Edison faces. As you can see, to sell the additional engine, Edison must lower his price from $80,000 to $60,000 per fire engine. Note that while Edison gains revenue from the additional engine he sells, he also loses revenue from the initial eight engines because he sells them all at the lower price. Use the purple rectangle (diamond symbols) to shade the area representing the revenue lost from the initial eight engines by selling at $60,000 rather than $80,000. Then use the green rectangle (triangle symbols) to shade the area representing the revenue gained from selling an additional engine at $60,000. 100 90 PRICE (Thousands of dollars per fire engine) 8 80 70 60 50 40 30 10 0 Edison 0 1 O True 2 O False + 6 3 4 5 7 QUANTITY (Fire…arrow_forwardImagine that you run the toll authority for a city bridge. You must charge all of your customers the exact same toll. Initially, you have set the price at $2 per trip. The blue line on the following graph shows the weekly demand curve for trips across the city bridge. On the following graph, use the purple rectangle (diamond symbols) to shade the area representing the total weekly revenue when the toll is $2 on the graph. Notice that when you click on the rectangle, the area is displayed. (? 10 TR at $2 8 Demand 7 TR at $3 5 2 1 8 12 16 20 24 28 32 38 40 QUANTITY (Thousands of vehicles per week) An advisor has suggested that you raise the toll to $3, the toll authority would bring in more revenue. To analyze this, use the green rectangle (triangle symbols) to shade the area representing the total weekly revenue when the toll is $3 on the graph. When the toll is $2, total revenue is S per week, but when the toll is $3, total revenue is $ per week. Based on your analysis, you can…arrow_forwardUse the accompanying graphs below to answer the questions about the market for apples current generation iPhonearrow_forward
- Asim's HookNLadder is the only company selling fire engines in the fictional country of Alexandrina. Asim initially produced eight trucks, but then decided to increase production to nine trucks. The following graph gives the demand curve faced by Asim's HookNLadder. As the graph shows, in order to sell the additional fire truck, Asim must lower the price from $80,000 to $40,000 per truck. Notice that Asim gains revenue from the sale of the additional engine, but at the same time, he loses revenue from the initial eight engines because they are all sold at the lower price. Use the purple rectangle (diamond symbols) to shade the area representing the revenue lost from the initial eight engines by selling at $40,000 rather than $80,000. Then use the green rectangle (triangle symbols) to shade the area representing the revenue gained from selling an additional engine at $40,000. PRICE (Thousands of dollars per fire engine) 220 Asim 200 180 160 140 120 100 80 60 40 20 0 0 1 True 2 False 4 5…arrow_forwardTim True increase production from 4 to 5 fire engines because the True or False: If Tim's Fire Engines were a competitive firm instead and $105,000 were the market price for an engine, increasing its production would not affect the price at which he can sell engines. False dominates in this scenario.arrow_forwardJabari's HookNLadder is the only company selling fire engines in the fictional country of Alexandrina. Jabari initially produced five trucks, but then decided to increase production to six trucks. The following graph gives the demand curve faced by Jabari's HookNLadder. As the graph shows, in order to sell the additional fire truck, Jabari must lower the price from $160,000 to $120,000 per truck. Notice that Jabari gains revenue from the sale of the additional engine, but at the same time, he loses revenue from the initial five engines because they are all sold at the lower price. Use the purple rectangle (diamond symbols) to shade the area representing the revenue lost from the initial five engines by selling at $120,000 rather than $160,000. Then use the green rectangle (triangle symbols) to shade the area representing the revenue gained from selling an additional engine at $120,000. PRICE (Thousands of dollars per fire engine) 220 200 180 160 140 120 100 80 60 40 0 Jabari 0 + 1 True…arrow_forward
- Imagine that you run the toll authority for a city bridge. You must charge all of your customers the exact same toll. Initially, you have set the price at $7 per trip. The blue line on the following graph shows the daily demand curve for trips across the city bridge. On the following graph, use the purple rectangle (diamond symbols) to shade the area representing the total daily revenue when the toll is $7 on the graph. Notice that when you click on the rectangle, the area is displayed. TOLL (Dollars per vehicle) 10 9 8 7 4 2 1 0 0 Demand 10 20 30 40 50 60 70 80 QUANTITY (Thousands of vehicles per day) 90 When the toll is $7, total revenue is $ 100 TR at $7 TR at $8 An advisor has suggested that if you raise the toll to $8, the toll authority would bring in more revenue. To analyze this, use the green rectangle (triangle symbols) to shade the area representing the total daily revenue when the toll is $8 on the graph. thousand per day, but when the toll is $8, total revenue is $ Based…arrow_forwardConsider two markets: the market for motorcycles and the market for pancakes. The initial equilibrium for both markets is the same, the equilibrium price is $4.50, and the equilibrium quantity is 29.0. When the price is $7.75, the quantity supplied of motorcycles is 65.0 and the quantity supplied of pancakes is 103.0. For simplicity of analysis, the demand for both goods is the same. Using the midpoint formula, calculate the elasticity of supply for pancakes. Please round to two decimal places.arrow_forwardThe linear demand curve for Pete's butternut squash and pecan pastry is Quantity = 205.5 12.78 x Price. What is the maximum Revenue (calculated as Price x Quantity) that Pete's can earn on this product, given the demand curve? (Rounding: penny.)arrow_forward
- Suppose that Paolo and Sharon are the only suppliers of collectible action figures in a particular market. The following table shows their annual supply schedules: Price Paolo's Quantity Supplied Sharon's Quantity Supplied (Dollars per action figure) (Action figures) (Action figures) 10 A-Z 4 8. 18 6. 12 24 8. 14 28 10 16 30 On the following graph, plot Paolo's supply of collectible action figures using the green points (triange symbol). Next, plot Sharon's supply of collectible action figures using the purple points (diamond symbol). Finally, plot the market supply of collectible action figures using the orange points (square symbol). Note: Line segments will automatically connect the points. Remember to plot from left to right. 12 Paolo's Supply 10 Sharon's Supply MacBook Air F12 F11 F10 F9 FB F7 F6 吕0 F5 O00 F4 F3 * delete &arrow_forward3. Consider the Smith family who have the following demand for rental housing (q, measured in square feet): q=0.5*(y/p), where y is the Smith family income and p is the price of housing per square foot. The Smith's income is $4000 per month and initially the price of housing is $2 per square foot per month. a. If the Smiths are operating on their demand curve, how much housing are they consuming? b. How much is the Smith family's monthly rent? How much does the Smith family spend on other consumption? c. Starting from the initial equilibrium, the government now grants the Smiths a proportional rent subsidy with B=0.5. How much housing does the Smith family purchase given the subsidy? d. What is the gross market rent per month paid by the Smith family? What is the net rent (after deducting the subsidy) paid by the Smith family? How much does the Smith family spend on other consumption in its new equilibrium? e. What is total dollar outlay of the government for the Smith's housing…arrow_forwardSuppose the market for sourdough is perfectly competitive, so sellers take the market price as given. Darnell manages a restaurant that offers sourdough for sale. The following graph plots Darnell's weekly supply curve (orange line). Point A represents a point along his supply curve. The price of sourdough is $2.25 per slice, which is given by the black horizontal line. PRICE (Dollars per slice) 9.00 8.25 7.50 6.75 6.00 5.25 4.50 3.75 3.00 2.25 1.50 0.75 Price Supply 0 2 4 XXX Darnell's Weekly Supply 6 A 8 10 12 14 16 18 QUANTITY (Slices of sourdough) 20 22 24 ? Using the previous graph, you can determine that Darnell is willing to supply his 6th weekly slice of sourdough for $ $2.25 per slice, the producer surplus earned from supplying the 6th slice of sourdough is $ Since he receives Suppose the price of sourdough were to rise to $3.00 per slice. At this higher price, Darnell would receive a producer surplus of $ 6th slice of sourdough he sells. The following graph plots the weekly…arrow_forward
arrow_back_ios
SEE MORE QUESTIONS
arrow_forward_ios
Recommended textbooks for you
 Principles of Economics (12th Edition)EconomicsISBN:9780134078779Author:Karl E. Case, Ray C. Fair, Sharon E. OsterPublisher:PEARSON
 Engineering Economy (17th Edition)EconomicsISBN:9780134870069Author:William G. Sullivan, Elin M. Wicks, C. Patrick KoellingPublisher:PEARSON
 Principles of Economics (MindTap Course List)EconomicsISBN:9781305585126Author:N. Gregory MankiwPublisher:Cengage Learning
 Managerial Economics: A Problem Solving ApproachEconomicsISBN:9781337106665Author:Luke M. Froeb, Brian T. McCann, Michael R. Ward, Mike ShorPublisher:Cengage Learning
 Managerial Economics & Business Strategy (Mcgraw-...EconomicsISBN:9781259290619Author:Michael Baye, Jeff PrincePublisher:McGraw-Hill Education
Principles of Economics (12th Edition)
Economics
ISBN:9780134078779
Author:Karl E. Case, Ray C. Fair, Sharon E. Oster
Publisher:PEARSON
Engineering Economy (17th Edition)
Economics
ISBN:9780134870069
Author:William G. Sullivan, Elin M. Wicks, C. Patrick Koelling
Publisher:PEARSON
Principles of Economics (MindTap Course List)
Economics
ISBN:9781305585126
Author:N. Gregory Mankiw
Publisher:Cengage Learning
Managerial Economics: A Problem Solving Approach
Economics
ISBN:9781337106665
Author:Luke M. Froeb, Brian T. McCann, Michael R. Ward, Mike Shor
Publisher:Cengage Learning
Managerial Economics & Business Strategy (Mcgraw-...
Economics
ISBN:9781259290619
Author:Michael Baye, Jeff Prince
Publisher:McGraw-Hill Education