
ENGR.ECONOMIC ANALYSIS
14th Edition
ISBN: 9780190931919
Author: NEWNAN
Publisher: Oxford University Press
expand_more
expand_more
format_list_bulleted
Related questions
Question
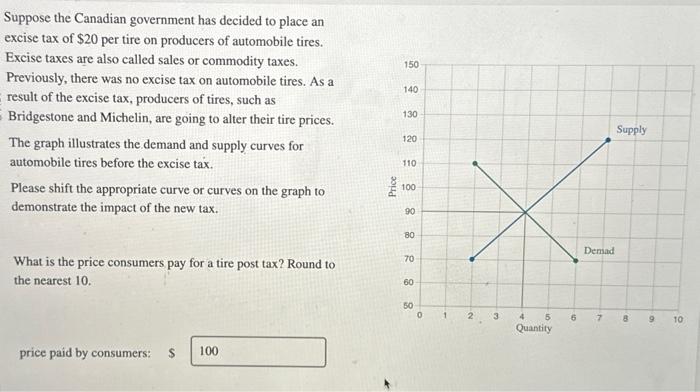

Transcribed Image Text:Suppose the Canadian government has decided to place an
excise tax of $20 per tire on producers of automobile tires.
Excise taxes are also called sales or commodity taxes.
Previously, there was no excise tax on automobile tires. As a
result of the excise tax, producers of tires, such as
Bridgestone and Michelin, are going to alter their tire prices.
The graph illustrates the demand and supply curves for
automobile tires before the excise tax.
Please shift the appropriate curve or curves on the graph to
demonstrate the impact of the new tax.
150
140
130
120
Price
888
110
100
90
Supply
80
00
60
50
°
1
2
3
4
5
Quantity
What is the price consumers pay for a tire post tax? Round to
the nearest 10.
70
288
price paid by consumers: $ 100
Demad
10
6
7
8
9
10
Expert Solution
This question has been solved!
Explore an expertly crafted, step-by-step solution for a thorough understanding of key concepts.

This is a popular solution

Trending nowThis is a popular solution!

Step by stepSolved in 3 steps with 2 images

Knowledge Booster


Learn more about
Need a deep-dive on the concept behind this application? Look no further. Learn more about this topic, economics and related others by exploring similar questions and additional content below.Similar questions
- Suppose the supply and demand equation are given as follow: Demand: Qd=112-3*p Supply: Qs=22+1*p What's the equilibrium quantity?arrow_forwardIn order to reduce farm output, raise farm prices, and thus raise farm incomes (revenues), the government pays farmers to set aside a portion of their land from production. Using a graph, explain in terms of the elasticity of demand for farm products why farmers may be better-off when harvests are low even if we ignore the money they receive from the set-aside program.arrow_forwardEconomists in Champaign have been studying the local market for pizza. The market is described in the graph below: What is the price elasticity of demand(in absolute value) when the price changes from $7 to $5?(Round your answer to include 2 decimal places.)arrow_forward
- The textbook discusses several things that determine how price elastic the supply of a good or service is. These are known as the determinants of the price elasticity of supply. Changes in these determinants can cause the elasticity of supply to change. The figure below shows a supply curve that starts out perfectly inelastic at S, and then becomes more elastic as it moves to S,, and then to S3. Which of the determinants of the elasticity of supply could this graph be representing? S. Price Quantity Determinant Represented by the Graph Drag appropriate answer(s) here time and the adjustment process %23 the flexibility of buyers change in income the flexibility of producers Drag appropriate answer(s) here Not a Determinant Represented by the Grapharrow_forwardUSE TABLE #1: For the market for electric automobiles, the equilibrium price is $ ________________ and the equilibrium quantity is___________ . (Remember to use a comma, if a comma is needed and to include the decimal point and two numbers to the right of the decimal point).arrow_forwardMany professional sports teams increase their ticket prices every year, but they keep selling out their home games. Does this mean that tickets to sporting events are not subject to the law of demand (law of demand states that an increase in price leads to a decrease in quantity demanded)? Please give an explanation.arrow_forward
- The linear demand curve is: Q = 100 - 4P The linear supply curve is: QS = -20 + 2P For each of the following questions, you need to show the basic calculation steps. 1) Given the above market demand and supply curves for the bottled wine in a hypothetical economy, please calculate the market equilibrium price and market equilibrium quantity for a bottle of wine. 2) If the government decides to charge an excise tax at the rate of 3 for each bottle of wine, what is the tax burden on consumers? And what is the tax burden on the firms? Show your calculation steps. B) Who shares more of the tax burden, the consumer or the firms? Please explain the reasons behind it.arrow_forwardRefer to Example 2.10, which analyzes the effects of price controls on natural gas. Recall that the free-market wholesale price of natural gas (PG) is $6.40 per mcf (thousand cubic feet), the average price of crude oil (Po) is $50 per barrel, and production and consumption of gas (Q) are 23 Tcf (trillion cubic feet). Suppose the price elasticity of supply of natural gas is 0.20, the cross-price elasticity of supply of natural gas with respect to the price of oil is 0.12, the price elasticity of demand for natural gas is -0.60, and the cross-price elasticity of demand for natural gas with respect to the price of oil is 1.25. If so, then the linear supply curve for natural gas is OA. Q=1.346-1.638PG +0.055PO B. Q=12.056+0.368PG -0.495PO- O C. Q=16.296 +0.495P + 1.638Po O D. Q=10.562 +1.066PG-0.327Po O E. Q=15.648+0.719P+0.055Poarrow_forwardDue to the government's program for developing alternative fuels, the demand for ethanol has increased dramatically. Ethanol is made from corn. Corn is also used as a feed for hogs. Simultaneously, many more cases of mad cow disease have been discovered in the United States. Assume that pork and beef are substitutes in consumption, but not in production. As a result of these two changes, what will happen to the price and output of pork? Briefly explain.arrow_forward
- The figure below represents the market for Gasoline, where initially the equilibrium price was $5.60. The picture shows the effect of a $1.50 tax on gasoline. Using the information from the figure, what is the price elasticity of supply(Using the Midpoint method) when moving from equilibrium to the new supply after the tax?(round your answer to 2 decimal places)arrow_forwardYou are an economist in the Internal Revenue System and just heard of a plan to increase the sales tax on a certain widget by $.06. Last year customers purchased about 10 million widgets. The demand curve in the last year was such that a $.01 increasein price decreases sales by 100,000. A study showed that a $.01 increase in price resulted in producers willing to provide 50,000 more widgets to the market. Congress stated that this$.06 tax will increase government revenues by $600,000 and raise the price of each widget by $.06. Is this correct? If so, explain why this is the case and, if not, what is the increase in prices and revenues?arrow_forwardDemand, Supply and Price Control A demand curve is a graphical representation of how much of a good or service households will want to buy at different prices. A supply curve is a graphical representation of how much of a good or service a firm is willing to sell at some specific price. The intersection of the demand and supply curve is called equilibrium. First, briefly explain the laws of supply and demand. In doing so, be certain your answer includes an explanation of the relationship between price and quantity for goods that are substitutes and for goods that are compliments; Then, briefly explain the relationship between price and quantity above the equilibrium price, and the relationship between price and quantity below the equilibrium price. In doing so, be certain your answer includes an explanation of the two separate conditions that result from each relationship to their related market inefficiencies; Next, briefly explain the two types of price controls that result in market…arrow_forward
arrow_back_ios
SEE MORE QUESTIONS
arrow_forward_ios
Recommended textbooks for you
 Principles of Economics (12th Edition)EconomicsISBN:9780134078779Author:Karl E. Case, Ray C. Fair, Sharon E. OsterPublisher:PEARSON
 Engineering Economy (17th Edition)EconomicsISBN:9780134870069Author:William G. Sullivan, Elin M. Wicks, C. Patrick KoellingPublisher:PEARSON
 Principles of Economics (MindTap Course List)EconomicsISBN:9781305585126Author:N. Gregory MankiwPublisher:Cengage Learning
 Managerial Economics: A Problem Solving ApproachEconomicsISBN:9781337106665Author:Luke M. Froeb, Brian T. McCann, Michael R. Ward, Mike ShorPublisher:Cengage Learning
 Managerial Economics & Business Strategy (Mcgraw-...EconomicsISBN:9781259290619Author:Michael Baye, Jeff PrincePublisher:McGraw-Hill Education
Principles of Economics (12th Edition)
Economics
ISBN:9780134078779
Author:Karl E. Case, Ray C. Fair, Sharon E. Oster
Publisher:PEARSON
Engineering Economy (17th Edition)
Economics
ISBN:9780134870069
Author:William G. Sullivan, Elin M. Wicks, C. Patrick Koelling
Publisher:PEARSON
Principles of Economics (MindTap Course List)
Economics
ISBN:9781305585126
Author:N. Gregory Mankiw
Publisher:Cengage Learning
Managerial Economics: A Problem Solving Approach
Economics
ISBN:9781337106665
Author:Luke M. Froeb, Brian T. McCann, Michael R. Ward, Mike Shor
Publisher:Cengage Learning
Managerial Economics & Business Strategy (Mcgraw-...
Economics
ISBN:9781259290619
Author:Michael Baye, Jeff Prince
Publisher:McGraw-Hill Education