
A First Course in Probability (10th Edition)
10th Edition
ISBN: 9780134753119
Author: Sheldon Ross
Publisher: PEARSON
expand_more
expand_more
format_list_bulleted
Related questions
Question
help with G
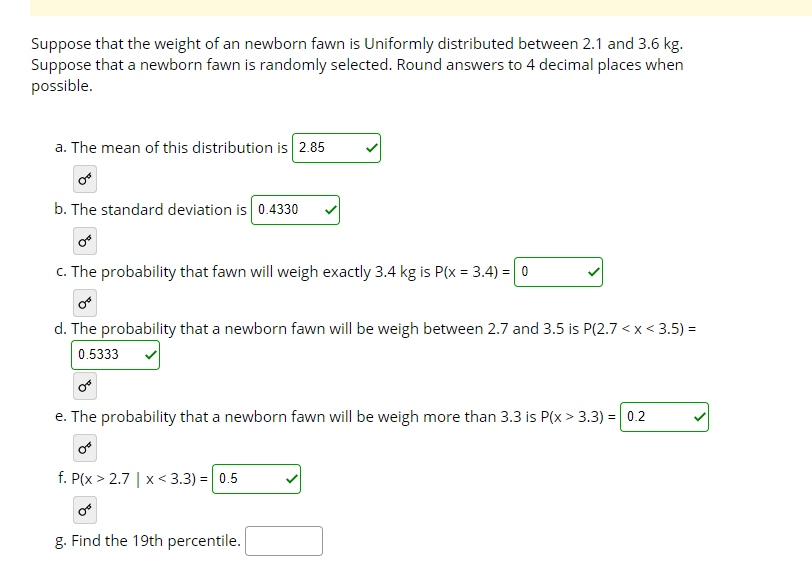

Transcribed Image Text:Suppose that the weight of an newborn fawn is Uniformly distributed between 2.1 and 3.6 kg.
Suppose that a newborn fawn is randomly selected. Round answers to 4 decimal places when
possible.
a. The mean of this distribution is 2.85
b. The standard deviation is 0.4330
c. The probability that fawn will weigh exactly 3.4 kg is P(x = 3.4) = 0
d. The probability that a newborn fawn will be weigh between 2.7 and 3.5 is P(2.7 <x< 3.5) =
0.5333
e. The probability that a newborn fawn will be weigh more than 3.3 is P(x > 3.3) = 0.2
f. P(x > 2.7 | x < 3.3) = 0.5
g. Find the 19th percentile.
Expert Solution
arrow_forward
Step 1
If X ~U(a,b)
Then
E(X)= b+a/2
V(X)= (b-a)^2/12
19th percentile is equal to 19/100

Trending nowThis is a popular solution!

Step by stepSolved in 2 steps with 1 images

Knowledge Booster


Learn more about
Need a deep-dive on the concept behind this application? Look no further. Learn more about this topic, probability and related others by exploring similar questions and additional content below.Similar questions
- Please show work in excel Mrs. Rio is an English professor at Pasadena City College who wants to see if there is a relationship between the students' grades and the hours they spend reading daily. Number of Students Grade Hours spend Reading (Daily) 1 79 2 2 32 0 3 89 3 4 100 5 5 84 4 6 7 90 66 5 2 7 79 4 8 56 5 9 77 5 10 88 3 Is there a direct or indirect relationship between Grades and number of hours reading? Is it weak or strong? Find and interpret the correlation coefficient What is the linear regression model? Predict the grade for a student who read 3.5 hours At 6% level of significant, can we predict that there is a significant relationship between grades and number of hours reading? What percent of the variation in grades is accounted for by hours spent reading?arrow_forwardIllustrate Linear independence?arrow_forwardClassify the variable below as qualitative, discrete, or continuous. Number of online purchases made in a montharrow_forward
- Determine whether the data described below is a quantitative of qualitative variable and explain why. The height of subjects in an experiment when testing a chemical. The data are qualitative because they consist of counts or measurements. The data are quantitative because they don't count nor measure anything. The data are qualitative because they don't count nor measure anything. The data are quantitative because they consist of counts or measurements.arrow_forwardF H Garrow_forwardClassify the variable below as qualitative, discrete, or continuous. The major field of study of students -- Select an Option-arrow_forward
- SCUBA divers have maximum dive times they cannot exceed when going to different depths. The data in the table below show different depths with the maximum dive times in minutes. (Comma separated lists of the data are also provided below the table to ease in copying the data to R.) Depth in Feet (x) 50 60 70 80 90 100 x: 50, 60, 70, 80, 90, 100 y: 179, 166, 150, 138, 124, 110 Maximum Dive Time in Minutes (y) 179 166 150 138 124 110 1. Find the best fit line for the data. y = + x 2. Graph the scatter plot of the data together with the best fit line using R. (This portion of the problem is not graded.) 3. Predict the maximum dive time at a depth of 23 feet. Question Help: D Post to forumarrow_forwardDiscrete Math Functionsarrow_forwardFind Domain and Rangearrow_forward
arrow_back_ios
arrow_forward_ios
Recommended textbooks for you
- A First Course in Probability (10th Edition)ProbabilityISBN:9780134753119Author:Sheldon RossPublisher:PEARSON

A First Course in Probability (10th Edition)
Probability
ISBN:9780134753119
Author:Sheldon Ross
Publisher:PEARSON