A First Course in Probability (10th Edition)
10th Edition
ISBN: 9780134753119
Author: Sheldon Ross
Publisher: PEARSON
expand_more
expand_more
format_list_bulleted
Concept explainers
Question

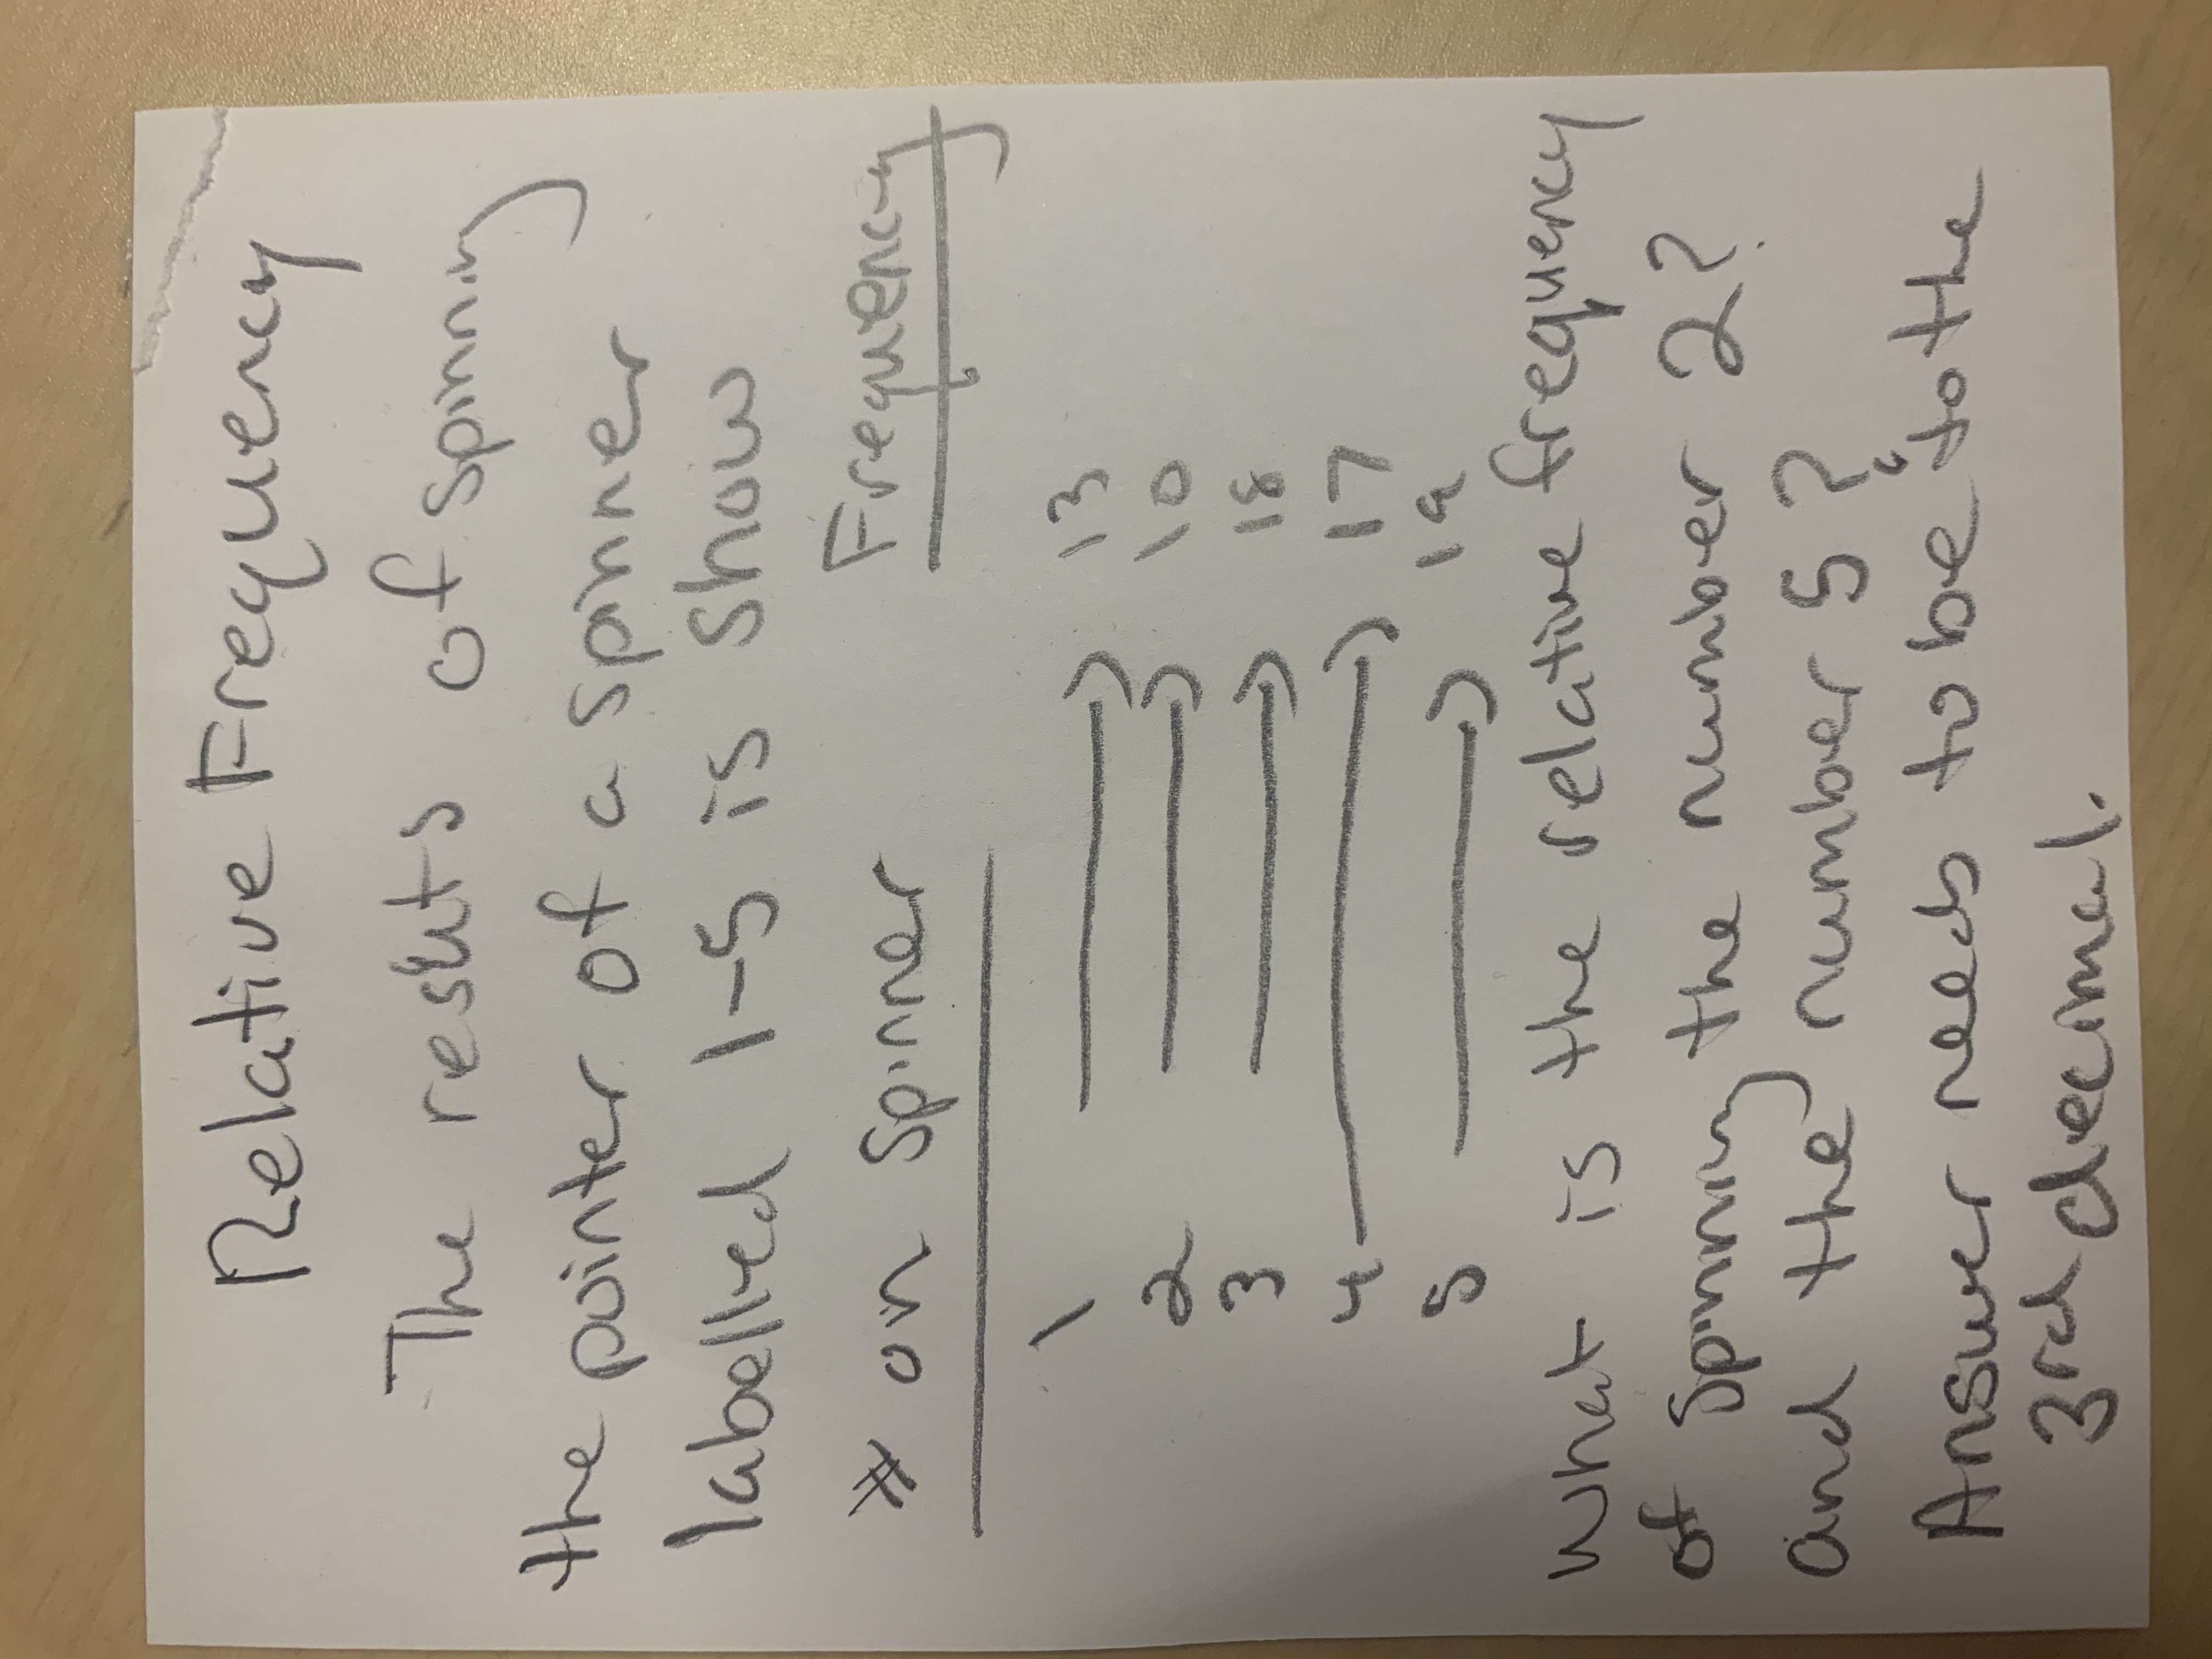
Transcribed Image Text:Relative Frequency
Expert Solution
This question has been solved!
Explore an expertly crafted, step-by-step solution for a thorough understanding of key concepts.
Step by stepSolved in 2 steps

Knowledge Booster
Learn more about
Need a deep-dive on the concept behind this application? Look no further. Learn more about this topic, probability and related others by exploring similar questions and additional content below.Similar questions
- Selling Price of single-family homes in Seattle are based on land values and structural improvements. You collected data on 28 recent single-family home sales in Seattle. You recorded selling price (in $000) and size (in square ft) of each home. You then completed a simple regression analysis to explain variation in selling price as a function of home size. (Attached picture) d) Interpret the value for the estmated slope coefficient for Size in this situation or context (be specifc) e) Interpret the value for the estimated intercept coefficient in this situation. Should we give any importance to the intercept interpretation? f) State the hypotheses associted with testing the statistical significance of the relationship between Size and Selling Price. What is your decision about the null hypothesis given alpha= 0.05 (reject or fail to reject)?arrow_forwardThe quantity demanded of a certain product, q, is given in terms of p, the price, by q = 1000e-0.05p (a) Write revenue, R, as a function of price. R(p) (b) Find the rate of change of revenue with respect to price. Rate of change of revenue = = (c) Find the revenue and rate of change of revenue with respect to price when the price is $12. Interpret your answers in economic terms. NOTE: Round your answers to the nearest integer. Revenue when the price is $12= This means that you will have about $Choose one if you sell the product for $ Choose one in revenuearrow_forwardFrequency 15 The histogram below represents the number of loans that have a specific interest rate. сл 5 10 10 5% 10% 15% 20% 25% Interest Rate Using this histogram, describe the center and spread of this data.arrow_forward
- Calculate the rate of change between the points labeled on the graph below. (-2, 10) 10 (0, 2) -5 O - 10 10arrow_forward450 (o0) 400 (4,400) 350 300 (3,300) 250 200 (2,200) 150 100 (1,100) 50 1 2 4 8. Months 10 11 12 Explain whether Account A shows a proportional relationship between months and the amount in the account. Explain whether Account B shows a proportional relationship between months and the amount in the account. Analyze the graph that shows a proportional relationship. Explain the meaning of the points (r, (2, y) and (1, r) where r is the unit rate. Amount in A Accour 3.arrow_forwardTrade Deficit The graph shows the values I (in billions of dollars) of goods imported to the United States and the values E (in billions of dollars) of goods exported from the United States from 1980 through 2013. Approximate the average rates of change of I and E (in billions of dollars per year) during each period.† A scatter plot titled Trade Deficit has a horizontal axis labeled t = Year (0 ↔ 1980) with values from 0 to 35 and a vertical axis labeled Value of goods (in billions of dollars) with values from 0 to 2,400. There are two groups of points on the scatterplot. The group of points labeled I has 34 points. A pattern goes up and right becoming more steep from (0, 250) to (33, 2,300). The points are as follows. (0, 250) (1, 270) (2, 250) (3, 270) (4, 330) (5, 340) (6, 370) (7, 410) (8, 450) (9, 480) (10, 500) (11, 490) (12, 540) (13, 590) (14, 670) (15, 750) (16, 800) (17, 880) (18, 920) (19, 1,040) (20, 1,230) (21, 1,150) (22, 1,170) (23, 1,270)…arrow_forward
- Regression analysisarrow_forwardRetailers are always interested in determining why a customer selected their store to make a purchase. A sporting goods retailer conducted a customer survey to determine why its customers shopped at the store. The results are shown below. Find the percentage of the customers responded that the merchandise was the reason they shopped at the store. Round to the nearest whole percent. Click the icon to view the results of the survey. OA. 50% B. 43% OC. 29% OD. 30% ...arrow_forwardData Set: {(−3,4), (−2, 3), (−1, 3), (0, 7), (1, 5), (2, 6), (3, 1)} 1. The regression line is: y = -2 FS 0.3 Your Turn: Data Set 2 2. Based on the regression line, we would expect the value of response variable to be 0.005 4. If x= -3.5, the y = 1 when the explanatory variable is 0. 3. For each increase of 1 in of the explanatory variable, we can expect a(n) decrease of 1 in the response variable. ovemple of F6 evtrannlation X O Search MALERINION 8 *. This is an g prt sc homearrow_forward
- Degree to which a scale informs you of the construct being measured is called__________; Discrepancy between what we’re measuring and the actual value of what we are measuring.arrow_forwardUnits of regression Consider a regression predicting weight (kg) from height (cm) for a sample of adult males. What are the units of the correlation coefficient, the intercept, and the slope?arrow_forwardone o Time Using Catalyst B (seconds) Time Using Catalyst A (seconds) 8. Trial 24 7 1 27 26 18 3 30 32 4 11 26 5 19 6. 32 22 7 19 30 8 26 23 9 22 10 19 16 11 20 13 12 25 26arrow_forward
arrow_back_ios
SEE MORE QUESTIONS
arrow_forward_ios
Recommended textbooks for you
 A First Course in Probability (10th Edition)ProbabilityISBN:9780134753119Author:Sheldon RossPublisher:PEARSON

A First Course in Probability (10th Edition)
Probability
ISBN:9780134753119
Author:Sheldon Ross
Publisher:PEARSON
