
MATLAB: An Introduction with Applications
6th Edition
ISBN: 9781119256830
Author: Amos Gilat
Publisher: John Wiley & Sons Inc
expand_more
expand_more
format_list_bulleted
Related questions
Question
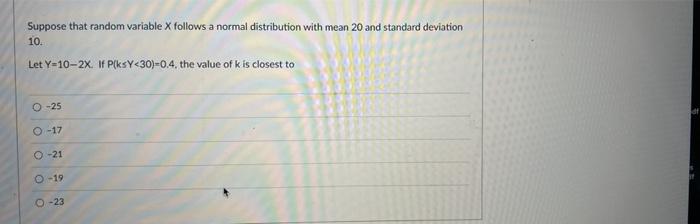

Transcribed Image Text:Suppose that random variable X follows a normal distribution with mean 20 and standard deviation
10.
Let Y=10-2x. If P(ksY<30)-0.4, the value of k is closest to
O -25
O -17
O -21
O-19
O-23
Expert Solution
This question has been solved!
Explore an expertly crafted, step-by-step solution for a thorough understanding of key concepts.

This is a popular solution

Trending nowThis is a popular solution!

Step by stepSolved in 3 steps with 3 images

Knowledge Booster

Similar questions
- The normal random variable X has mean 4 and variance 1.22. Find the probability that: * * X < 2.5 X lies between 2.5 and 7arrow_forwardLet x be a random variable that represents the weights in kilograms (kg) of healthy adult female deer (does) in December in a national park. Then x has a distribution that is approximately normal with mean u = 57.0 kg and standard deviation o = 7.9 kg. Suppose a doe that weighs less than 48 kg is considered undernourished. (a) What is the probability that a single doe captured (weighed and released) at random in December is undernourished? (Round your answer to four decimal places.) (b) If the park has about 2350 does, what number do you expect to be undernourished in December? (Round your answer to the nearest whole number.) does (c) To estimate the health of the December doe population, park rangers use the rule that the average weight of n = 55 does should be more than 54 kg. If the average weight is less than 54 kg, it is thought that the entire population of does might be undernourished. What is the probability that the average welght x for a random sample of 55 does is less than…arrow_forwardLet x be a random variable that represents hemoglobin count (HC) in grams per 100 milliliters of whole blood. Then x has a distribution that is approximately normal, with population mean of about 14 for healthy adult women. Suppose that a female patient has taken 10 laboratory blood tests during the past year. The HC data sent to the patient's doctor are as follows. 14 19 17 20 15 12 13 18 17 10 (a) Use a calculator with sample mean and standard deviation keys to find x and s. (Round your answers to two decimal places.) x= s= (b) Does this information indicate that the population average HC for this patient is higher than 14? Use ? = 0.01. (i) State the null hypotheses H0 and the alternate hypothesis H1 . H0 : μ ---Select--- < = ≤ > ≠ ≥ H1 : μ ---Select--- > = ≥ ≤ < ≠ (ii) What is the value of the sample test statistic? (Round your answer to three decimal places.) (iii) Compute the P-value. (Round your answer to four decimal places.)…arrow_forward
- If the random variable X has a normal distribution with mean = 48 and standard deviation = 18, then P(1.2 ≤ X ≤ 4.8) is...arrow_forwardLet x be a random variable that represents hemoglobin count (HC) in grams per 100 milliliters of whole blood. Then x has a distribution that is approximately normal, with population mean of about 14 for healthy adult women. Suppose that a female patient has taken 10 laboratory blood tests during the past year. The HC data sent to the patient's doctor are as follows. 14 17 16 18 15 12 14 17 17 11 (i) Use a calculator with sample mean and standard deviation keys to find x and s. (Round your answers to two decimal places.) x = s = (ii) Does this information indicate that the population average HC for this patient is higher than 14? Use α = 0.01. (a) What is the level of significance? State the null and alternate hypotheses. a: μ = 14; H1: μ < 14 b: μ = 14; H1: μ ≠ 14 c: μ > 14; H1: μ = 14 d: μ < 14; H1: μ = 14 e: μ = 14; H1: μ > 14 (b) What sampling distribution will you use? Explain the rationale for your choice of sampling distribution. The standard normal, since we assume…arrow_forwardSuppose the random variable X follows a normal distribution with mean 70 and variance 100. Then the probability is 0.6826 that X is in the symmetric interval about the mean between two numbers are O A. None O B. 70 and 90 O C. -1 and 1 OD. 60 and 80arrow_forward
- Let x be a random variable that represents hemoglobin count (HC) in grams per 100 milliliters of whole blood. Then x has a distribution that is approximately normal, with population mean of about 14 for healthy adult women. Suppose that a female patient has taken 10 laboratory blood tests during the past year. The HC data sent to the patient's doctor are as follows. 14 18 15 19 13 11 15 18 15 12 (i) Use a calculator with sample mean and standard deviation keys to find x and s. (Round your answers to two decimal places.) X = S = (ii) Does this information indicate that the population average HC for this patient is higher than 14? Use a = 0.01. (a) What is the level of significance? State the null and alternate hypotheses. О Но: и 3D 14;B Hі: и 14; Hі: и %3D 14 Но: и 14 О Но: и 3D 14;B Hi: и # 14 (b) What sampling distribution will you use? Explain the rationale for your choice of sampling distribution. O The standard normal, since we assume that x has a normal distribution and o is…arrow_forwardAssume that the random variable X is normally distributed with mean = 186.8 and standard deviation = 32. Let n = 50. Find P(195< < 200).arrow_forwardSuppose that a random sample of size 25 is to be selected from a population with mean 46 and standard deviation 8. What is the approximate probability that X will be more than .5 away from the population mean?arrow_forward
- 2. Suppose X is a normally distributed random variable with a mean of 9.00. If the probability that X is less than 9.66 is 0.67, then what is the standard deviation of X?arrow_forward3. If Z is a random variable having the standard normal distribution, find i. P(Z - 1.08) iii. P(-1.90arrow_forwardSuppose that average rainfall in your city is normally distributed, and for the past 36 months, the rainfall has been 0.5 inches per day on average with a standard deviation of 0.16. Let x be a random variable that has a normal distribution and represents the rainfall in inches per day. Using a 0.05 level of significance, you want to test the hypothesis that monthly rainfall has been 0.7 inches per day on average. What conclusion do you make from your test? Select one: a. Reject H0; the average rainfall is not 0.5 inches. b. Reject H0; the average rainfall is not 0.7 inches. c. Do not reject H0; the average rainfall is still 0.5 inches. d. Do not reject H0; the average rainfall is still 0.7 inches.arrow_forward
arrow_back_ios
SEE MORE QUESTIONS
arrow_forward_ios
Recommended textbooks for you
- MATLAB: An Introduction with ApplicationsStatisticsISBN:9781119256830Author:Amos GilatPublisher:John Wiley & Sons Inc
 Probability and Statistics for Engineering and th...StatisticsISBN:9781305251809Author:Jay L. DevorePublisher:Cengage Learning
 Statistics for The Behavioral Sciences (MindTap C...StatisticsISBN:9781305504912Author:Frederick J Gravetter, Larry B. WallnauPublisher:Cengage Learning
  Elementary Statistics: Picturing the World (7th E...StatisticsISBN:9780134683416Author:Ron Larson, Betsy FarberPublisher:PEARSON
 The Basic Practice of StatisticsStatisticsISBN:9781319042578Author:David S. Moore, William I. Notz, Michael A. FlignerPublisher:W. H. Freeman
 Introduction to the Practice of StatisticsStatisticsISBN:9781319013387Author:David S. Moore, George P. McCabe, Bruce A. CraigPublisher:W. H. Freeman
MATLAB: An Introduction with Applications
Statistics
ISBN:9781119256830
Author:Amos Gilat
Publisher:John Wiley & Sons Inc
Probability and Statistics for Engineering and th...
Statistics
ISBN:9781305251809
Author:Jay L. Devore
Publisher:Cengage Learning
Statistics for The Behavioral Sciences (MindTap C...
Statistics
ISBN:9781305504912
Author:Frederick J Gravetter, Larry B. Wallnau
Publisher:Cengage Learning
Elementary Statistics: Picturing the World (7th E...
Statistics
ISBN:9780134683416
Author:Ron Larson, Betsy Farber
Publisher:PEARSON
The Basic Practice of Statistics
Statistics
ISBN:9781319042578
Author:David S. Moore, William I. Notz, Michael A. Fligner
Publisher:W. H. Freeman
Introduction to the Practice of Statistics
Statistics
ISBN:9781319013387
Author:David S. Moore, George P. McCabe, Bruce A. Craig
Publisher:W. H. Freeman