MATLAB: An Introduction with Applications
6th Edition
ISBN: 9781119256830
Author: Amos Gilat
Publisher: John Wiley & Sons Inc
expand_more
expand_more
format_list_bulleted
Question

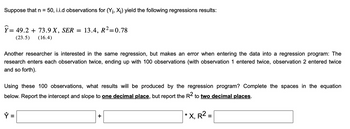
Transcribed Image Text:Suppose that n = 50, i.i.d observations for (Y₁, X₁) yield the following regressions results:
Ÿ= 49.2 + 73.9 X, SER = 13.4, R²=0.78
(23.5) (16.4)
Another researcher is interested in the same regression, but makes an error when entering the data into a regression program: The
research enters each observation twice, ending up with 100 observations (with observation 1 entered twice, observation 2 entered twice
and so forth).
Using these 100 observations, what results will be produced by the regression program? Complete the spaces in the equation
below. Report the intercept and slope to one decimal place, but report the R2 to two decimal places.
+
*
X, R² =
Expert Solution
This question has been solved!
Explore an expertly crafted, step-by-step solution for a thorough understanding of key concepts.
Step by stepSolved in 3 steps with 3 images

Follow-up Questions
Read through expert solutions to related follow-up questions below.
Follow-up Question

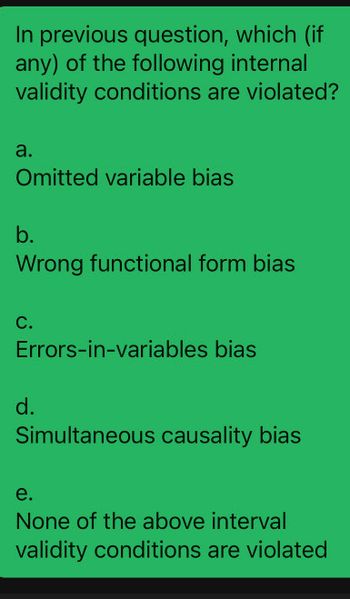
Transcribed Image Text:In previous question, which (if
any) of the following internal
validity conditions are violated?
a.
Omitted variable bias
b.
Wrong functional form bias
C.
Errors-in-variables bias
d.
Simultaneous causality bias
e.
None of the above interval
validity conditions are violated
Solution
by Bartleby Expert
Follow-up Questions
Read through expert solutions to related follow-up questions below.
Follow-up Question

Transcribed Image Text:In previous question, which (if
any) of the following internal
validity conditions are violated?
a.
Omitted variable bias
b.
Wrong functional form bias
C.
Errors-in-variables bias
d.
Simultaneous causality bias
e.
None of the above interval
validity conditions are violated
Solution
by Bartleby Expert
Knowledge Booster
Similar questions
- A regression was run to determine if there is a relationship between hours of study per week (xx) and the final exam scores (yy).The results of the regression were: y=ax+b a=6.22 b=21.6 r2=0.477481 r=0.691 Use this to predict the final exam score of a student who studies 8 hours per week, and please round your answer to a whole number.arrow_forwardUsing 23 observations on each variable, a computer program generated the following multiple regression model. y = 65.5 +9.56x1+3.27x2-4.23x3– 9.23x4 If the standard errors of the coefficients of the independent variables are, respectively, 3.44, 2.30, 2.76, and 4.99, can you conclude that the independent variable x, is needed in the regression model? Let B1, B2, Ba denote the coefficients of the 4 variables in this model, and use a two-sided hypothesis test and significance level of 0.10 to determine your 4 .../ answer. (a) State the null hypothesis H, and the alternative hypothesis H,. H, : 0 H, : 0 (b) Determine the type of test statistic to use. Degrees of freedom: D=0 OSO (c) Find the value of the test statistic. (Round to two or more decimal places.) O#0 OO (d) Find the two critical values at the 0.10 level of significance. (Round to two or more decimal places.) | and || (e) Can you conclude that the independent variable is needed in the regression model? Yes No 미arrow_forwardA regression was run to determine if there is a relationship between hours of TV watched per day (x) and number of situps a person can do (y). The results of the regression were: y=ax+b a=-1.307 b=32.392 r²=0.675684 r=-0.822 Use this to predict the number of situps a person who watches 12.5 hours of TV can do (to one decimal place)arrow_forward
- A researcher records age in years (x) and systolic blood pressure (y) for volunteers. They perform a regression analysis was performed, and a portion of the computer output is as follows: ŷ = 4.5+ 14.4x Coefficients (Intercept) x Estimate 4.5 Ho: B₁ = 0 H₁: B₁ > 0 Ho: B₁ = 0 Ha: B₁ <0 14.4 Ho: B₁ = 0 Ha: B₁ #0 Std. Error Test statistic 2.9 4.7 1.55 3.06 P-value Specify the null and the alternative hypotheses that you would use in order to test whether a linear relationship exists between x and y. 0.07 0arrow_forwardA researcher conducted a number of descriptive statistics for two variables X and Y. They were as follows: SP = 15; SSx = 3; My = 7; Mx = 3 What is b equal to (Please include the sign: e.g., -20)? What is a equal to (please include the sign: e.g., +4.0)? Using b and a construct a regression equation, and then using the regression equation, calculate the value of predicted Y when X = 2?arrow_forwardA set of n = 25 pairs of scores (X and Y values) produces a regression equation Y = 3X – 2. Findthe predicted Y value for each of the following X scores: 0, 1, 3, -2.arrow_forward
arrow_back_ios
arrow_forward_ios
Recommended textbooks for you
 MATLAB: An Introduction with ApplicationsStatisticsISBN:9781119256830Author:Amos GilatPublisher:John Wiley & Sons Inc
 Probability and Statistics for Engineering and th...StatisticsISBN:9781305251809Author:Jay L. DevorePublisher:Cengage Learning
 Statistics for The Behavioral Sciences (MindTap C...StatisticsISBN:9781305504912Author:Frederick J Gravetter, Larry B. WallnauPublisher:Cengage Learning
 Elementary Statistics: Picturing the World (7th E...StatisticsISBN:9780134683416Author:Ron Larson, Betsy FarberPublisher:PEARSON
 The Basic Practice of StatisticsStatisticsISBN:9781319042578Author:David S. Moore, William I. Notz, Michael A. FlignerPublisher:W. H. Freeman
 Introduction to the Practice of StatisticsStatisticsISBN:9781319013387Author:David S. Moore, George P. McCabe, Bruce A. CraigPublisher:W. H. Freeman

MATLAB: An Introduction with Applications
Statistics
ISBN:9781119256830
Author:Amos Gilat
Publisher:John Wiley & Sons Inc

Probability and Statistics for Engineering and th...
Statistics
ISBN:9781305251809
Author:Jay L. Devore
Publisher:Cengage Learning

Statistics for The Behavioral Sciences (MindTap C...
Statistics
ISBN:9781305504912
Author:Frederick J Gravetter, Larry B. Wallnau
Publisher:Cengage Learning

Elementary Statistics: Picturing the World (7th E...
Statistics
ISBN:9780134683416
Author:Ron Larson, Betsy Farber
Publisher:PEARSON

The Basic Practice of Statistics
Statistics
ISBN:9781319042578
Author:David S. Moore, William I. Notz, Michael A. Fligner
Publisher:W. H. Freeman

Introduction to the Practice of Statistics
Statistics
ISBN:9781319013387
Author:David S. Moore, George P. McCabe, Bruce A. Craig
Publisher:W. H. Freeman