
MATLAB: An Introduction with Applications
6th Edition
ISBN: 9781119256830
Author: Amos Gilat
Publisher: John Wiley & Sons Inc
expand_more
expand_more
format_list_bulleted
Related questions
Question
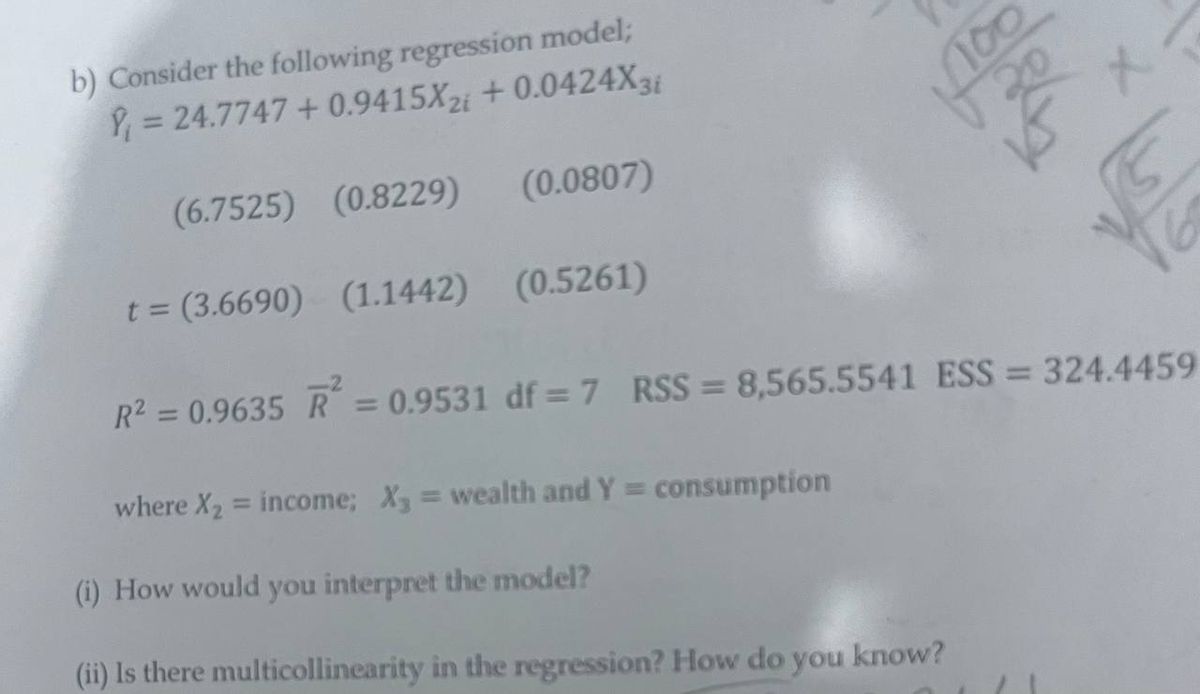

Transcribed Image Text:b) Consider the following regression model;
= 24.7747 +0.9415X2i +0.0424X31
(6.7525) (0.8229)
t = (3.6690) (1.1442) (0.5261)
R² = 0.9635 R = 0.9531 df =7 RSS = 8,565.5541 ESS = 324.4459
(0.0807)
where X₂ = income; X3 = wealth and Y= consumption
(i) How would you interpret the model?
(ii) Is there multicollinearity in the regression? How do you know?
Expert Solution
This question has been solved!
Explore an expertly crafted, step-by-step solution for a thorough understanding of key concepts.

Step by stepSolved in 4 steps with 27 images

Knowledge Booster

Similar questions
- A regression was run to determine if there is a relationship between hours of study per week (x) and the final exam scores (y). The results of the regression were: y=ax+b a=5.865 b=25.06 r²=0.81 r=0.9 Use this to predict the final exam score of a student who studies 4.5 hours per week, and please round your answer to a whole number.arrow_forwardA regression was run to determine if there is a relationship between hours of study per week (x) and the final exam Scores (y). The results of the regression were: y=ax+b a=6.179 b=28.96 r²=0.937024 r=0.968 Use this to predict the final exam score of a student who studies 4 hours per week, and please round your answer to a whole number.arrow_forwardA regression was run to determine if there is a relationship between hours of study per week (X) and the test scores (y ). The results of the regression were:y=ax+ba=5.931b=20.1r2=0.748225r=0.865Use this to predict the final exam score of a student who studies 3 hours per week, and please round your answer to a whole number.arrow_forward
- A regression was run to determine if there is a relationship between hours of TV watched per day (x) and number of situps a person can do (y). The results of the regression were: y%3ax+b a=-1.219 b=29.882 r2=0.727609 r=-0.853 Use this to predict the number of situps a person who watches 11 hours of TV can do (to one decimal place)arrow_forwardA regression was run to determine if there is a relationship between hours of TV watched per day (x) and number of situps a person can do (y). The results of the regression were: y=ax+b a=-0.794 b=31.311 r²=0.9801 r=-0.99 Use this to predict the number of situps a person who watches 8 hours of TV can do (to one decimal place)arrow_forwardA regression was run to determine if there is a relationship between hours of TV watched per day (xx) and number of situps a person can do (yy). The results of the regression were: y=ax+ba=-1.392b=32.952r2=0.527076r=-0.726Use this to predict the number of situps a person who watches 2 hour(s) of TV can do, and please round your answer to a whole number.arrow_forward
- A regression was run to determine if there is a relationship between hours of study per week (xx) and the final exam scores (yy).The results of the regression were: y=ax+b a=5.226 b=34.56 r2=0.904401 r=0.951 Use this to predict the final exam score of a student who studies 1 hours per week, and please round your answer to a whole number?arrow_forwardA regression was run to determine if there is a relationship between hours of study per week (xx) and the test scores (yy).The results of the regression were:y=ax+b a=6.686 b=35.26 r2=0.6084 r=0.78 Use this to predict the final exam score of a student who studies 8.5 hours per week, and please round your answer to a whole number.arrow_forwardA regression was run to determine if there is a relationship between hours of TV watched per day (xx) and number of situps a person can do (yy).The results of the regression were:y=ax+b a=-0.629 b=39.045 r2=0.806404 r=-0.898 Use this to predict the number of situps a person who watches 6.5 hour(s) of TV can do, and please round your answer to a whole number.arrow_forward
arrow_back_ios
arrow_forward_ios
Recommended textbooks for you
- MATLAB: An Introduction with ApplicationsStatisticsISBN:9781119256830Author:Amos GilatPublisher:John Wiley & Sons Inc
 Probability and Statistics for Engineering and th...StatisticsISBN:9781305251809Author:Jay L. DevorePublisher:Cengage Learning
 Statistics for The Behavioral Sciences (MindTap C...StatisticsISBN:9781305504912Author:Frederick J Gravetter, Larry B. WallnauPublisher:Cengage Learning
  Elementary Statistics: Picturing the World (7th E...StatisticsISBN:9780134683416Author:Ron Larson, Betsy FarberPublisher:PEARSON
 The Basic Practice of StatisticsStatisticsISBN:9781319042578Author:David S. Moore, William I. Notz, Michael A. FlignerPublisher:W. H. Freeman
 Introduction to the Practice of StatisticsStatisticsISBN:9781319013387Author:David S. Moore, George P. McCabe, Bruce A. CraigPublisher:W. H. Freeman
MATLAB: An Introduction with Applications
Statistics
ISBN:9781119256830
Author:Amos Gilat
Publisher:John Wiley & Sons Inc
Probability and Statistics for Engineering and th...
Statistics
ISBN:9781305251809
Author:Jay L. Devore
Publisher:Cengage Learning
Statistics for The Behavioral Sciences (MindTap C...
Statistics
ISBN:9781305504912
Author:Frederick J Gravetter, Larry B. Wallnau
Publisher:Cengage Learning
Elementary Statistics: Picturing the World (7th E...
Statistics
ISBN:9780134683416
Author:Ron Larson, Betsy Farber
Publisher:PEARSON
The Basic Practice of Statistics
Statistics
ISBN:9781319042578
Author:David S. Moore, William I. Notz, Michael A. Fligner
Publisher:W. H. Freeman
Introduction to the Practice of Statistics
Statistics
ISBN:9781319013387
Author:David S. Moore, George P. McCabe, Bruce A. Craig
Publisher:W. H. Freeman