MATLAB: An Introduction with Applications
6th Edition
ISBN: 9781119256830
Author: Amos Gilat
Publisher: John Wiley & Sons Inc
expand_more
expand_more
format_list_bulleted
Question

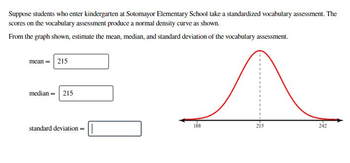
Transcribed Image Text:Suppose students who enter kindergarten at Sotomayor Elementary School take a standardized vocabulary assessment. The
scores on the vocabulary assessment produce a normal density curve as shown.
From the graph shown, estimate the mean, median, and standard deviation of the vocabulary assessment.
mean = 215
median = 215
standard deviation = |
188
215
242
Expert Solution
This question has been solved!
Explore an expertly crafted, step-by-step solution for a thorough understanding of key concepts.
This is a popular solution
Trending nowThis is a popular solution!
Step by stepSolved in 3 steps with 2 images

Knowledge Booster
Similar questions
- A dataset contains the categorical variable Gender as well as the quantitative variable Computer Games for the number of hours spent playing computer games per week. Use the side-by-side graph in the figure below showing the distribution of hours spent playing computer games for boys and girls to answer the following questions. Estimate the median time for girls playing games. Do we expect the mean time for girls to be greater than, smaller than, or about the same as the median? Do we expect the mean time for boys to be greater than, smaller than, or about the same as the median? Who spends more time playing computer games? 1 Farrow_forwardUse the dotplot to find the mean, median, and IQR. Round to 1 decimal place, if needed. Caution: This could be a different data set than the one in the previous question. 74 76 78 80 82 84 86 Heights of Basketball Players mean median IQR (in inches) (in inches) (in inches)arrow_forwardshould have the right to marry. (The 2014 data were collected before the 2015 U.S. C2. GSS 2014 and GSS 2018 respondents were asked their opinion on whether homosexuals 30 measured on a 5-point scale from strongly agree (1) to strongly disagree (5). Supreme Court decision granting same-sex couples the right to marry. Responses wer measured on a 5-point scale from strongly agree (1) to strong!y aisagiee (2). Cumulative Percentage Homosexuals Should Have Right to Marry (2014) Percentage Frequency 32.5 32.5 Strongly agree 251 57.5 25.2 Agree 195 67.3 Neither agree nor disagree 9.6 74 79.2 Disagree 92 11.9 100.0 Strongly disagree 161 20.8 Total 773 100.0 Homosexuals Should Have Cumulative Right to Marry (2018) Frequency Percentage Percentage Strongly agree 293 39.5 39.5 Agree 200 27.0 66.5 Neither agree nor disagree 70 9.4 75.9 Disagree 67 9.0 84.9 Strongly disagree 111 15.0 99.9 Total 741 99.9 a. What is the level of measurement for this variable? b. What is the mode for 2014? For 2018?arrow_forward
- Find the mean and standard deviation for the individualized instruction scores. Scores Individualized Instruction 50 - 59 2 60 69 8. 70 - 79 9 80 - 89 11 90 99 9. Mean = %3D (Round to the nearest hundredth.)arrow_forwardWhich of the three brands had the smallest mean lifetime? Try doing this without a calculator- just compare the three plots.arrow_forwardHow can I Calculate the mean and median of the data set by hand.arrow_forward
- Suppose the mean of X is 6. What is the mean of Y if a = 0.66 and Y=aX?arrow_forwardClick the score that is one standard deviation below the mean. IQ Test Scores 30 40 50 60 70 80 90 100 110 120 130 140 150 160arrow_forwardUse the coefficient of variation to determine whether coffee prices or gasoline prices were more stable in 2015. Use the population standard and population mean of each set of data. What is the coefficient of variation for the price of a pound of coffee and a pound of gasoline?arrow_forward
- Use these Reading scores to anwser the following questions 7, 7, 8,10,14 ,11,13, 9, 8,12,15,15 A. Find the mean of the reading scores B. Write the value of the standard deviation in decimal formarrow_forwardThe line drawn within the box of the box-and-whisker plot represents the mean. TRUE FALSEarrow_forwardCan someone please help? Thank you.arrow_forward
arrow_back_ios
SEE MORE QUESTIONS
arrow_forward_ios
Recommended textbooks for you
 MATLAB: An Introduction with ApplicationsStatisticsISBN:9781119256830Author:Amos GilatPublisher:John Wiley & Sons Inc
 Probability and Statistics for Engineering and th...StatisticsISBN:9781305251809Author:Jay L. DevorePublisher:Cengage Learning
 Statistics for The Behavioral Sciences (MindTap C...StatisticsISBN:9781305504912Author:Frederick J Gravetter, Larry B. WallnauPublisher:Cengage Learning
 Elementary Statistics: Picturing the World (7th E...StatisticsISBN:9780134683416Author:Ron Larson, Betsy FarberPublisher:PEARSON
 The Basic Practice of StatisticsStatisticsISBN:9781319042578Author:David S. Moore, William I. Notz, Michael A. FlignerPublisher:W. H. Freeman
 Introduction to the Practice of StatisticsStatisticsISBN:9781319013387Author:David S. Moore, George P. McCabe, Bruce A. CraigPublisher:W. H. Freeman

MATLAB: An Introduction with Applications
Statistics
ISBN:9781119256830
Author:Amos Gilat
Publisher:John Wiley & Sons Inc

Probability and Statistics for Engineering and th...
Statistics
ISBN:9781305251809
Author:Jay L. Devore
Publisher:Cengage Learning

Statistics for The Behavioral Sciences (MindTap C...
Statistics
ISBN:9781305504912
Author:Frederick J Gravetter, Larry B. Wallnau
Publisher:Cengage Learning

Elementary Statistics: Picturing the World (7th E...
Statistics
ISBN:9780134683416
Author:Ron Larson, Betsy Farber
Publisher:PEARSON

The Basic Practice of Statistics
Statistics
ISBN:9781319042578
Author:David S. Moore, William I. Notz, Michael A. Fligner
Publisher:W. H. Freeman

Introduction to the Practice of Statistics
Statistics
ISBN:9781319013387
Author:David S. Moore, George P. McCabe, Bruce A. Craig
Publisher:W. H. Freeman