
MATLAB: An Introduction with Applications
6th Edition
ISBN: 9781119256830
Author: Amos Gilat
Publisher: John Wiley & Sons Inc
expand_more
expand_more
format_list_bulleted
Related questions
Question
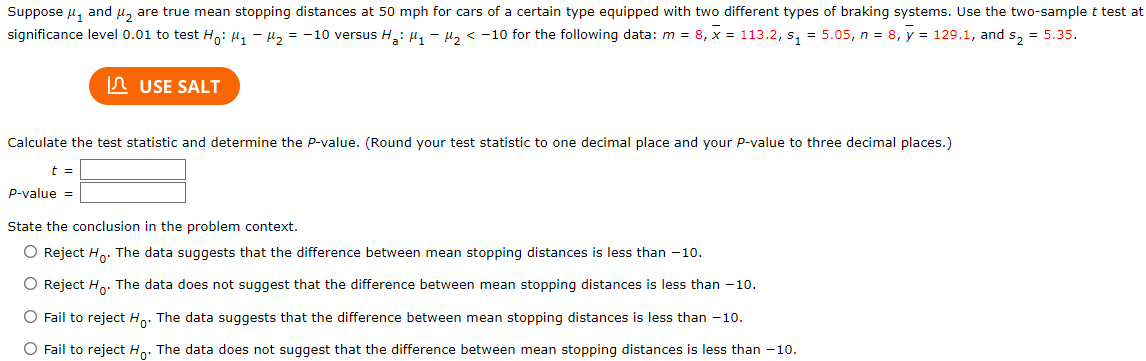

Transcribed Image Text:Suppose μ₁ and ₂ are true mean stopping distances at 50 mph for cars of a certain type equipped with two different types of braking systems. Use the two-sample t test at
significance level 0.01 to test Ho: M₁ - μ₂ = -10 versus H₂: ₁-₂ < -10 for the following data: m = 8, x = 113.2, s₁=5.05, n = 8, y = 129.1, and s₂ = 5.35.
USE SALT
Calculate the test statistic and determine the P-value. (Round your test statistic to one decimal place and your P-value to three decimal places.)
t =
P-value =
State the conclusion in the problem context.
O Reject Ho. The data suggests that the difference between mean stopping distances is less than -10.
O Reject Ho. The data does not suggest that the difference between mean stopping distances is less than 10.
O Fail to reject Ho. The data suggests that the difference between mean stopping distances is less than -10.
O Fail to reject Ho. The data does not suggest that the difference between mean stopping distances is less than -10.
Expert Solution
This question has been solved!
Explore an expertly crafted, step-by-step solution for a thorough understanding of key concepts.

Step by stepSolved in 5 steps with 18 images

Knowledge Booster

Similar questions
- The Department of Agriculture wants to determine whether the mean yield per acre for a particular variety of soybeans is different this year compared to the historical avg yield of 520 bushels per acre. Thus, the null and alternative hypotheses are Ho: mu = 520 Ha: mu is not = to 520 You set out to conduct a hypothesis test at the 95% level. Mean yields are distributed Normally. You take a sample of 36 different acres. From this sample, you calculate a mean yield of 573 and a std deviation of 24. Do you reject or not-reject the null hypothesis? Group of answer choices Do not reject the null hypothesis. Reject the null hypothesis.arrow_forwardSuppose data is collected to predict y from x. If the size of Sample ✓ Calculate the p-value if the test statistic is t = -1.38arrow_forwardIt has been estimated that the 1991 G-car obtains a mean of 35 miles per gallon on the highway, and the company that manufactures the car claims that it exceeds the estimate in highway driving. To support its assertion, the company randomly selects 49 1991 G-cars and records the mileage obtained for each car over a driving course similar to that used to obtain the estimate. The following data resulted: x = 36.5 miles per gallon, s = 7 miles per gallon. %3D a. Find the observed significance level for testing Ho: u= 35 vs. Ha: u> 35. %3D b. For what value of significance level a, you will reject the null hypothesis.arrow_forward
- Suppose that you had collected the following sample data (in inches) on the diameters of tree trunks, measured at waist level and growing at 2000’ elevation in the Cascade Mountains: 9.0, 6.2, 6.5, 7.0, 10.5 and 8.8. The sample Inter Quartile Range is: (a) 5.5 (b) 4.5 (c) 3.5 (d) 2.5 (e) 4.0 (f) None of the abovearrow_forwardIs the proportion of wildfires caused by humans in the south lower than the proportion of wildfires caused by humans in the west? 360 of the 501 randomly selected wildfires looked at in the south were caused by humans while 435 of the 588 randomly selected wildfires looked at the west were caused by humans. What can be concluded at the = 0.10 level of significance? For this study, we should use Select an answer t-test for the difference between two dependent population means z-test for the difference between two population proportions t-test for a population mean t-test for the difference between two independent population means z-test for a population proportion The null and alternative hypotheses would be: Select an answer μ1 p1 Select an answer < ≠ > = Select an answer μ2 p2 (please enter a decimal) Select an answer μ1 p1 Select an answer > ≠ < = Select an answer p2 μ2 (Please enter a decimal) The test statistic ? z t = (please show your…arrow_forwardYou wish to test the following claim (Ha) at a significance level of a = 0.02. For the context of this problem, 44 = PostTest - PreTest where the first data set represents a pre-test and the second data set represents a post-test. (Each row represents the pre and post test scores for an individual. Be careful when you enter your data and specify what your 4i and u2 are so that the differences are computed correctly.) H.:Hd = 0 0 + Prl : "H You believe the population of difference scores is normally distributed, but you do not know the standard deviation. You obtain the following sample of data: pre-test post-test 44.8 52.3 47.6 44.1 56.6 51.2 50.4 54.8 55.4 58.9 38 44.1 32.1 36 41.7 52.6 36.9 45.9 50.8 55 52.5 65.8 35.7 38.5 39.3 30.8 36.4 33.4 53.7 60 What is the test statistic for this sample? test statistic = (Report answer accurate to 4 decimal places.) What is the p-value for this sample? p-value = (Report answer accurate to 4 decimal places.) The p-value is... O less than (or…arrow_forward
- A data set includes weights of garbage discarded in one week from 62 different households. The paired weights of paper and glass were used to obtain the results shown to the right. Is there sufficient evidence to support the claim that there is a linear correlation between weights of discarded paper and glass? Use a significance level of α = 0.05. Click here to view a table of critical values for the correlation coefficient. Determine the null and alternative hypotheses. Ho: P H₁: p (Type # V 11 > cimals. Do not round.) ... Correlation matrix: Variables Paper Glass 10.1768 Paper Glass 0.1768 1arrow_forwardA physical therapist wanted to know whether the mean step pulse of men was less than the mean step pulse of women. She randomly selected 50 men and 74 women to participate in the study. Each subject was required to step up and down a 6-inch platform. The pulse of each subject was then recorded. The following results were obtained. Two sample T for Men vs Women Mean N StDev SE Mean Men Women 95% Cl for mu Men - mu Women (- 10.67, - 1.13) T-Test mu Men = mu Women (vs H2 B. Ho: H1 = H2;arrow_forwardarrow_back_iosarrow_forward_ios
Recommended textbooks for you
- MATLAB: An Introduction with ApplicationsStatisticsISBN:9781119256830Author:Amos GilatPublisher:John Wiley & Sons Inc
 Probability and Statistics for Engineering and th...StatisticsISBN:9781305251809Author:Jay L. DevorePublisher:Cengage Learning
 Statistics for The Behavioral Sciences (MindTap C...StatisticsISBN:9781305504912Author:Frederick J Gravetter, Larry B. WallnauPublisher:Cengage Learning
  Elementary Statistics: Picturing the World (7th E...StatisticsISBN:9780134683416Author:Ron Larson, Betsy FarberPublisher:PEARSON
 The Basic Practice of StatisticsStatisticsISBN:9781319042578Author:David S. Moore, William I. Notz, Michael A. FlignerPublisher:W. H. Freeman
 Introduction to the Practice of StatisticsStatisticsISBN:9781319013387Author:David S. Moore, George P. McCabe, Bruce A. CraigPublisher:W. H. Freeman
MATLAB: An Introduction with Applications
Statistics
ISBN:9781119256830
Author:Amos Gilat
Publisher:John Wiley & Sons Inc
Probability and Statistics for Engineering and th...
Statistics
ISBN:9781305251809
Author:Jay L. Devore
Publisher:Cengage Learning
Statistics for The Behavioral Sciences (MindTap C...
Statistics
ISBN:9781305504912
Author:Frederick J Gravetter, Larry B. Wallnau
Publisher:Cengage Learning
Elementary Statistics: Picturing the World (7th E...
Statistics
ISBN:9780134683416
Author:Ron Larson, Betsy Farber
Publisher:PEARSON
The Basic Practice of Statistics
Statistics
ISBN:9781319042578
Author:David S. Moore, William I. Notz, Michael A. Fligner
Publisher:W. H. Freeman
Introduction to the Practice of Statistics
Statistics
ISBN:9781319013387
Author:David S. Moore, George P. McCabe, Bruce A. Craig
Publisher:W. H. Freeman