MATLAB: An Introduction with Applications
6th Edition
ISBN: 9781119256830
Author: Amos Gilat
Publisher: John Wiley & Sons Inc
expand_more
expand_more
format_list_bulleted
Concept explainers
Topic Video
Question

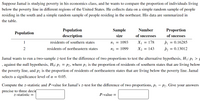
Transcribed Image Text:Suppose Jamal is studying poverty in his economics class, and he wants to compare the proportion of individuals living
below the poverty line in different regions of the United States. He collects data on a simple random sample of people
residing in the south and a simple random sample of people residing in the northeast. His data are summarized in
the table.
Population
Sample
Number
Proportion
Рopulation
description
size
of successes
of sucesses
1
residents of southern states
n¡ = 1093
X1 = 178
= 0.16285
%3D
2
residents of northeastern states
n2 = 1099
X2
= 143
= 0.13012
Jamal wants to run a two-sample z-test for the difference of two proportions to test the alternative hypothesis, H1: p1 > !
against the null hypothesis, Ho: P1 = P2, where pi is the proportion of residents of southern states that are living below
the poverty line, and p2 is the proportion
residents of northeastern states that are living below the poverty line. Jamal
selects a significance level of a = 0.05.
Compute the z-statistic and P-value for Jamal's z-test for the difference of two proportions, pi – P2.
Give
your answers
precise to three decir
z-statistic =
P-value =

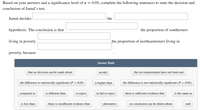
Transcribed Image Text:Based on your answers and a significance level of a = 0.05, complete the following sentences to state the decision and
conclusion of Jamal's test.
Jamal decides
the
hypothesis. The conclusion is that
the proportion of southerners
living in poverty
the proportion of northeasterners living in
poverty, because
Answer Bank
that no decision can be made about
ассept
the test requirements have not been met
the difference is statistically significant (P < 0.05)
is higher than
the difference is not statistically significant (P > 0.05)
compared to
is different than
to reject
to fail to reject
there is sufficient evidence that
is the same as
is less than
there is insufficient evidence that
alternative
no conclusion can be drawn about
null
Expert Solution
This question has been solved!
Explore an expertly crafted, step-by-step solution for a thorough understanding of key concepts.
This is a popular solution
Trending nowThis is a popular solution!
Step by stepSolved in 3 steps with 1 images

Knowledge Booster
Learn more about
Need a deep-dive on the concept behind this application? Look no further. Learn more about this topic, statistics and related others by exploring similar questions and additional content below.Similar questions
- 1. In 1955, Life Magazine reported that a 25-year-old mother of 3 children, worked an average of 80 hours each week. Recently, some researchers have been studying whether the women’s movement has resulted in an increase in the work week hours for women (combining employment and at-home work). A study was done to find out if the mean work week has, in fact, increased. A random sample of 81 women were surveyed and the mean was 83 hours with a standard deviation of 10. Using a 95% confidence level, does the sample data support the researcher’s claim that the average number of weekly hours that women work, is greater than 80? a. What statistical test will you use to test this data ? b. State the null and alternative hypothesis. i. H0: ii. Ha: c. What are the confidence intervals? d. What is the value of the test statistic? e. What is the p-value? f. Circle/highlight the correct decision about the null hypothesis. Reject H0…arrow_forwardThe owner of a chain of mini-markets has two stores, Store 1 and Store 2, in one city. She recently added a breakfast station in Store 1 and wants to determine if the mean daily sales of Store 1 is greater than the mean daily sales of Store 2. After choosing 12 days at random, she records the sales (in dollars) at Store 1 for these days. Then, she records the sales at Store 2 for these same days. The data and the differences (Store 1 minus Store 2) are shown in the table below. Day 1 2 3 4 5 6 7 8. 9. 10 11 12 Store 1 951 547 437 682 547 729 488 776 461 815 859 518 Store 2 989 599 500 680 451 528 452 741 446 758 960. 421 Difference (Store 1 − Store 2) −38 −52 63 2 96 201. 36 35 15 57 −101 97 Send data to calculator Send data to Excel (a)Are the two samples of daily sales amounts independent or paired…arrow_forward4. Two people are arguing about the size of different breeds of dogs. One believes that German shepherds are larger than huskies, while the other person believes the opposite is true. They conduct a study to see which one of them is correct. They sample the weights of ten dogs of each breed. The data are as follows: German Shepherds: 55, 72, 61, 43, 59, 70, 67, 49, 55, 63 Huskies: 48, 77, 46, 51, 60, 44, 53, 61, 52, 41 (a) Should a one-tailed or two-tailed test be conducted? Why? (b) Conduct the appropriate test with alpha = 0.05. Which breed is larger or are they the same?arrow_forward
- Education influences attitude and lifestyle. Differences in education are a big factor in the "generation gap." Is the younger generation really better educated? Large surveys of people age 65 and older were taken in n1 = 38 U.S. cities. The sample mean for these cities showed that x1 = 15.2% of the older adults had attended college. Large surveys of young adults (age 25 - 34) were taken in n2 = 37 U.S. cities. The sample mean for these cities showed that x2 = 18.1% of the young adults had attended college. From previous studies, it is known that ?1 = 6.4% and ?2 = 4.8%. Does this information indicate that the population mean percentage of young adults who attended college is higher? Use ? = 0.05. What is the value of the sample test statistic? (Test the difference ?1 − ?2. Round your answer to two decimal places.)=__(c) Find (or estimate) the P-value. (Round your answer to four decimal places.)=__arrow_forwardMany people like to play app based games on their mobile devices. Suppose we would like to estimate the average amount of time (in hours) per week students have played an app-based game on their mobile device at CSU Stan. In order to do this, we take a random sample of 20 students and ask them how many hours they have played an app- based game in the last week. The following data were collected: 11 4 5.5 5.5 7 6.2 10 10 7.5 6 7 7.5 2.5 Which of the following is the correct 99% confidence interval for the estimate of the average number of hours (per week) that all CSU Stan students have played an app- based game? [5.28, 7.59] [4.86, 8.01] [5.48,7.39] [5.86, 7.01]arrow_forward1) A consumer research company wants to estimate the average cost of an airline ticket for a round trip from New York to Los Angeles. A random sample of 50 airfares had an average price of $438. Identify the variable. (a) Simple random sample (c) Consumer research company (b) Airline fare (d) City e) $438arrow_forward
- A sociologist studying New York City ethnic groups wants to determine if there is a difference in income for immigrants from four different countries during their first year in the city. She obtained the data in the following table from a random sample of immigrants from these countries (incomes in thousands of dollars). Use a 0.05 level of significance to test the claim that there is no difference in the earnings of immigrants from the four different countries. Country I Country II Country III Country IV 12.3 8.3 20.4 17.3 9.1 17.2 16.5 8.7 10.9 19.2 22.8 14.2 8.8 10.2 5.5 21.4 16.1 19.2 19.3 (b) Find SSTOT, SSBET, and SSW and check that SSTOT = SSBET + SSW. (Round your answers to three decimal places.) SSTOT = SSBET = SSW = Find d.f.BET, d.f.W, MSBET, and MSW. (Round your answer to three decimal places for MSBET and MSW.) dfBET = dfW = MSBET = MSW = Find the value of the sample F statistic. (Round your answer to three decimal…arrow_forwardEducation influences attitude and lifestyle. Differences in education are a big factor in the "generation gap." Is the younger generation really better educated? Large surveys of people age 65 and older were taken in n1 = 38 U.S. cities. The sample mean for these cities showed that x1 = 15.2% of the older adults had attended college. Large surveys of young adults (age 25 - 34) were taken in n2 = 37 U.S. cities. The sample mean for these cities showed that x2 = 18.1% of the young adults had attended college. From previous studies, it is known that ?1 = 6.4% and ?2 = 4.8%. Does this information indicate that the population mean percentage of young adults who attended college is higher? Use ? = 0.05. (c) Find (or estimate) the P-value. (Round your answer to four decimal places.) A random sample of n1 = 12 winter days in Denver gave a sample mean pollution index x1 = 43. Previous studies show that ?1 = 15. For Englewood (a suburb of Denver), a random sample of n2 = 16 winter days gave a…arrow_forwardOn average, a sample of n = 36 scores will provide a better estimate of the population mean than a sample of n = 49 scores from the same population.arrow_forward
arrow_back_ios
arrow_forward_ios
Recommended textbooks for you
 MATLAB: An Introduction with ApplicationsStatisticsISBN:9781119256830Author:Amos GilatPublisher:John Wiley & Sons Inc
 Probability and Statistics for Engineering and th...StatisticsISBN:9781305251809Author:Jay L. DevorePublisher:Cengage Learning
 Statistics for The Behavioral Sciences (MindTap C...StatisticsISBN:9781305504912Author:Frederick J Gravetter, Larry B. WallnauPublisher:Cengage Learning
 Elementary Statistics: Picturing the World (7th E...StatisticsISBN:9780134683416Author:Ron Larson, Betsy FarberPublisher:PEARSON
 The Basic Practice of StatisticsStatisticsISBN:9781319042578Author:David S. Moore, William I. Notz, Michael A. FlignerPublisher:W. H. Freeman
 Introduction to the Practice of StatisticsStatisticsISBN:9781319013387Author:David S. Moore, George P. McCabe, Bruce A. CraigPublisher:W. H. Freeman

MATLAB: An Introduction with Applications
Statistics
ISBN:9781119256830
Author:Amos Gilat
Publisher:John Wiley & Sons Inc

Probability and Statistics for Engineering and th...
Statistics
ISBN:9781305251809
Author:Jay L. Devore
Publisher:Cengage Learning

Statistics for The Behavioral Sciences (MindTap C...
Statistics
ISBN:9781305504912
Author:Frederick J Gravetter, Larry B. Wallnau
Publisher:Cengage Learning

Elementary Statistics: Picturing the World (7th E...
Statistics
ISBN:9780134683416
Author:Ron Larson, Betsy Farber
Publisher:PEARSON

The Basic Practice of Statistics
Statistics
ISBN:9781319042578
Author:David S. Moore, William I. Notz, Michael A. Fligner
Publisher:W. H. Freeman

Introduction to the Practice of Statistics
Statistics
ISBN:9781319013387
Author:David S. Moore, George P. McCabe, Bruce A. Craig
Publisher:W. H. Freeman