
MATLAB: An Introduction with Applications
6th Edition
ISBN: 9781119256830
Author: Amos Gilat
Publisher: John Wiley & Sons Inc
expand_more
expand_more
format_list_bulleted
Related questions
Concept explainers
Topic Video
Question
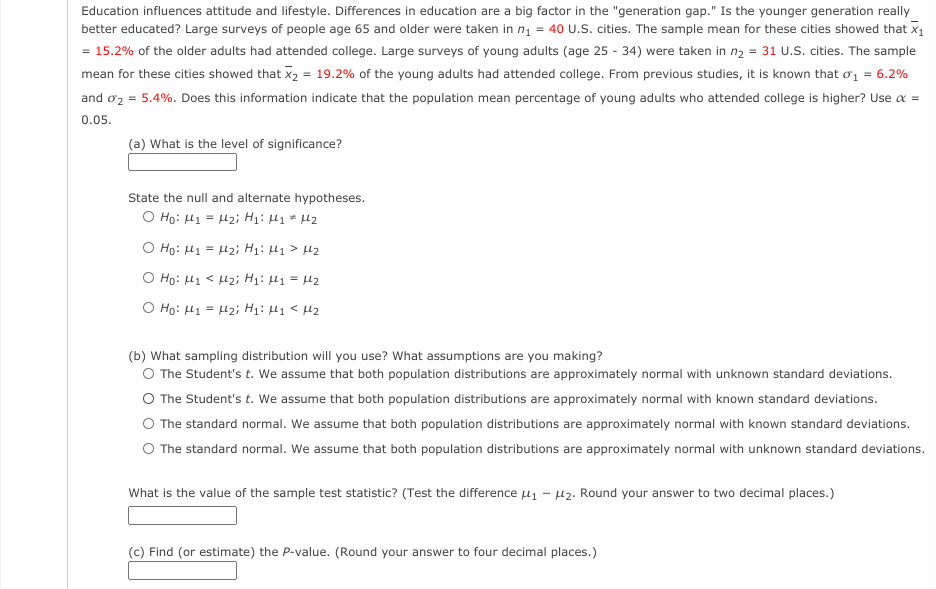

Transcribed Image Text:Education influences attitude and lifestyle. Differences in education are a big factor in the "generation gap." Is the younger generation really
better educated? Large surveys of people age 65 and older were taken in n = 40 U.S. cities. The sample mean for these cities showed that x1
= 15.2% of the older adults had attended college. Large surveys of young adults (age 25 - 34) were taken in n, = 31 U.S. cities. The sample
mean for these cities showed that x2 = 19.2% of the young adults had attended college. From previous studies, it is known that o1 = 6.2%
and o2 = 5.4%. Does this information indicate that the population mean percentage of young adults who attended college is higher? Use a =
0.05.
(a) What is the level of significance?
State the null and alternate hypotheses.
O Ho: H1 = l2; H1: H1 * l2
Ho: H1 = l2; H1:H1 > H2
O Ho: H1 < l2; H1: H1 = H2
O Ho: H1 = l2; H1: H1 < µ2
(b) What sampling distribution will you use? What assumptions are you making?
O The Student's t. We assume that both population distributions are approximately normal with unknown standard deviations.
The Student's t. We assume that both population distributions are approximately normal with known standard deviations.
The standard normal. We assume that both population distributions are approximately normal with known standard deviations.
O The standard normal. We assume that both population distributions are approximately normal with unknown standard deviations.
What is the value of the sample test statistic? (Test the difference u1 - µ2. Round your answer to two decimal places.)
(c) Find (or estimate) the P-value. (Round your answer to four decimal places.)
Expert Solution
This question has been solved!
Explore an expertly crafted, step-by-step solution for a thorough understanding of key concepts.

Step by stepSolved in 4 steps with 3 images

Knowledge Booster


Learn more about
Need a deep-dive on the concept behind this application? Look no further. Learn more about this topic, statistics and related others by exploring similar questions and additional content below.Similar questions
- 3. Of all the pupils in a particular school, 45 % go to school by bus. In a random sample of 30 pupils, calculate the mean and variance number of pupils that go to school by bus.arrow_forwardEducation influences attitude and lifestyle. Differences in education are a big factor in the "generation gap." Is the younger generation really better educated? Large surveys of people age 65 and older were taken in n1 = 38 U.S. cities. The sample mean for these cities showed that x1 = 15.2% of the older adults had attended college. Large surveys of young adults (age 25 - 34) were taken in n2 = 37 U.S. cities. The sample mean for these cities showed that x2 = 18.1% of the young adults had attended college. From previous studies, it is known that ?1 = 6.4% and ?2 = 4.8%. Does this information indicate that the population mean percentage of young adults who attended college is higher? Use ? = 0.05. What is the value of the sample test statistic? (Test the difference ?1 − ?2. Round your answer to two decimal places.)=__(c) Find (or estimate) the P-value. (Round your answer to four decimal places.)=__arrow_forwardIn the US, 45.1% of all people have type O blood, 39.6% have type A blood, 10.9% have type B blood and 4.4% have type AB blood. A researcher wants to see if the distribution of blood type is different for millionaires. The table below shows the results of a random sample of 614 millionaires. What can be concluded at the significant level of a = 0.05. For this study, we should use Chi-Square test for Goodness of Fit Your friend Caroline helped you with the null and alternative hypotheses... Ho : The distributions of blood types are the same between the general population and the millionaires. Ha: The distributions of blood types are NOT the same between the general population and the millionaires. You drew 614 samples, and the observed frequencies are recorded below. Please complete the table (round answers to at least 4 decimal places). Blood Type 0 A B AB Observed Count 274 230 57 53 Expected Count Click Download CSV to download csv file of data or copy/paste the data into Excel.…arrow_forward
- The Bureau of Labor Statistics reports that the official unemployment rate for Black people was 10.4% and 4.7% for White people in February 2015. Select all correct answers for this question. O The samples of white and black people are independent. The explanatory variable is the unemployment rate. The response variable is the unemployment rate. The response variable is race.arrow_forwardA magazine reports that women trust recommendations from a particular social networking site more than recommendations from any other social network platform. But does trust in this social networking site differ by gender? The following sample data show the number of women and men who stated in a recent sample that they trust recommendations made on this particular social networking site. Women Men Sample 150 170 Trust RecommendationsMade on the social networking site 117 102 (a) What is the point estimate of the proportion of women who trust recommendations made on this particular social networking site? (b) What is the point estimate of the proportion of men who trust recommendations made on this particular social networking site? (c) Provide a 95% confidence interval estimate of the difference between the proportion of women and men who trust recommendations made on this particular social networking site. (Round your answers to four decimal places.) toarrow_forwardBy a small margin, Facebook remains the top choice of social media over all ages, with 29% using Facebook most often among those using social media sites. However, more visually oriented social networks such as Snapchat and Instagram continue to draw in younger audiences. When asked "Which one social networking brand do you use most often?" the results in the table show the top brands chosen by Americans aged 12-34 who currently use any social networking site or service. Social M edia Site Faceboo k Snapchat Instagra m Twitter Percentage That Use Most Often 29 28 26 6 20 (a) What is the sum of the percentages for these top social media sites? Give your answer as an exact number. Macmillan Learning top social media sites: What percent of Americans aged 12-34 use other social media sites most often? Give your answer as an exact number. other social media sites: do %arrow_forward
- 4. A college student is contemplating a possible career option. One factor that will influence his decision is the amount of money he is likely to make. He decides to look up the average salary of graduates in that profession. Which information would be more useful to him, the mean salary or the median salary? Why?arrow_forward5. In the United States, there is a strong relationship between education and smoking: well-educated people are less likely to smoke. Does a similar relationship hold in France? To find out, researchers recorded the level of education and smoking status of a random sample of 459 French men aged 20 to 60 years.36 The two-way table below displays the data. Is there convincing evidence of an association between smoking status and educational level among French men aged 20 to 60 years? Smoking Status Nonsmoker Former Moderate Heavy Primary School 56 54 41 36 Education Secondary School 37 43 27 32 University 53 28 36 16arrow_forwardAbout 4% of the population has a particular genetic mutation. 300 people are randomly selected.Find the mean for the number of people with the genetic mutation in such groups of 300. (Remember that means should be rounded to one more decimal place than the raw data.)arrow_forward
- Page 160 #17 We predict that children exhibit more aggressive act after watching a violent television show. The scores for ten children were recorded before they watched a violent show and then after they watched a violent show. Aggression was measured in terms of number of aggressive acts (e.g. hitting, yelling, kicking etc). Sample 1 (after TV show): 5,6,4,4,7,3,2,1,4,1 Sample 2 (before TV show): 4,6,3,2,4,1,0,0,5,2 Is this a one-tailed or two-tailed test?arrow_forwardEducation influences attitude and lifestyle. Differences in education are a big factor in the "generation gap." Is the younger generation really better educated? Large surveys of people age 65 and older were taken in n1 = 38 U.S. cities. The sample mean for these cities showed that x1 = 15.2% of the older adults had attended college. Large surveys of young adults (age 25 - 34) were taken in n2 = 37 U.S. cities. The sample mean for these cities showed that x2 = 18.1% of the young adults had attended college. From previous studies, it is known that ?1 = 6.4% and ?2 = 4.8%. Does this information indicate that the population mean percentage of young adults who attended college is higher? Use ? = 0.05. (c) Find (or estimate) the P-value. (Round your answer to four decimal places.) A random sample of n1 = 12 winter days in Denver gave a sample mean pollution index x1 = 43. Previous studies show that ?1 = 15. For Englewood (a suburb of Denver), a random sample of n2 = 16 winter days gave a…arrow_forwardif a study determines the difference in average salary for subpopulations of people with blue eyes and people with brown eyes is not significant then the populations are blue-eyed people and brown-eyed people are what different salariesarrow_forward
arrow_back_ios
SEE MORE QUESTIONS
arrow_forward_ios
Recommended textbooks for you
- MATLAB: An Introduction with ApplicationsStatisticsISBN:9781119256830Author:Amos GilatPublisher:John Wiley & Sons Inc
 Probability and Statistics for Engineering and th...StatisticsISBN:9781305251809Author:Jay L. DevorePublisher:Cengage Learning
 Statistics for The Behavioral Sciences (MindTap C...StatisticsISBN:9781305504912Author:Frederick J Gravetter, Larry B. WallnauPublisher:Cengage Learning
  Elementary Statistics: Picturing the World (7th E...StatisticsISBN:9780134683416Author:Ron Larson, Betsy FarberPublisher:PEARSON
 The Basic Practice of StatisticsStatisticsISBN:9781319042578Author:David S. Moore, William I. Notz, Michael A. FlignerPublisher:W. H. Freeman
 Introduction to the Practice of StatisticsStatisticsISBN:9781319013387Author:David S. Moore, George P. McCabe, Bruce A. CraigPublisher:W. H. Freeman
MATLAB: An Introduction with Applications
Statistics
ISBN:9781119256830
Author:Amos Gilat
Publisher:John Wiley & Sons Inc
Probability and Statistics for Engineering and th...
Statistics
ISBN:9781305251809
Author:Jay L. Devore
Publisher:Cengage Learning
Statistics for The Behavioral Sciences (MindTap C...
Statistics
ISBN:9781305504912
Author:Frederick J Gravetter, Larry B. Wallnau
Publisher:Cengage Learning
Elementary Statistics: Picturing the World (7th E...
Statistics
ISBN:9780134683416
Author:Ron Larson, Betsy Farber
Publisher:PEARSON
The Basic Practice of Statistics
Statistics
ISBN:9781319042578
Author:David S. Moore, William I. Notz, Michael A. Fligner
Publisher:W. H. Freeman
Introduction to the Practice of Statistics
Statistics
ISBN:9781319013387
Author:David S. Moore, George P. McCabe, Bruce A. Craig
Publisher:W. H. Freeman