
MATLAB: An Introduction with Applications
6th Edition
ISBN: 9781119256830
Author: Amos Gilat
Publisher: John Wiley & Sons Inc
expand_more
expand_more
format_list_bulleted
Related questions
Question

Transcribed Image Text:**Transcription for Educational Website**
**Scenario Description:**
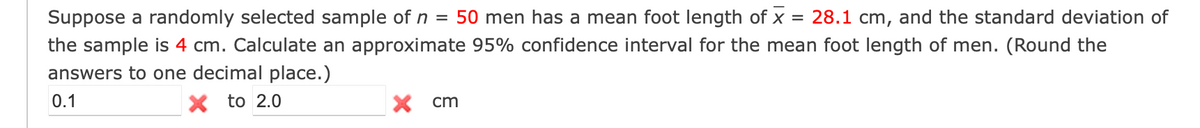
Suppose a randomly selected sample of \( n = 50 \) men has a mean foot length of \( \bar{x} = 28.1 \) cm, and the standard deviation of the sample is 4 cm. Calculate an approximate 95% confidence interval for the mean foot length of men. (Round the answers to one decimal place.)
**Answer Input:**
- Lower limit of confidence interval: \(0.1\) cm (incorrect indication provided by a red cross)
- Upper limit of confidence interval: \(2.0\) cm (incorrect indication provided by a red cross)
**Explanation:**
The task involves finding a 95% confidence interval for the mean foot length based on the provided sample data. The existing answers (0.1 cm to 2.0 cm) were marked incorrect, indicating the calculation needs reconsideration using the provided mean, standard deviation, and sample size.
Expert Solution
This question has been solved!
Explore an expertly crafted, step-by-step solution for a thorough understanding of key concepts.

This is a popular solution

Trending nowThis is a popular solution!

Step by stepSolved in 2 steps

Knowledge Booster

Similar questions
- A normal population has a mean μ = 40 and standard deviation σ = 8. What proportion of the population is between 37 and 48?arrow_forwardUse z scores to compare the given values. Based on sample data, newborn males have weights with a mean of 3287.6 g and a standard deviation of 563.8 g. Newborn females have weights with a mean of 3008.2 g and a standard deviation of 680.6 g. Who has the weight that is more extreme relative to the group from which they came: a male who weighs 1700 g or a female who weighs 1700 g? Since the z score for the male is z = and the z score for the female is z = the V has the weight that is more extreme. (Round to two decimal places.)arrow_forwardSuppose the standard deviation of the sample mean is equal to 0.6. If a sample of size n=100n=100 is collected, what is the population standard deviation?arrow_forward
- The scores of a certain population on the wechler intelligence scale for children are thought to be normally distributed, witharrow_forwardUse z scores to compare the given values. Based on sample data, newborn males have weights with a mean of 3263.8 g and a standard deviation of 841.2 g. Newborn females have weights with a mean of 3066.6 g and a standard deviation of 570.2 g. Who has the weight that is more extreme relative to the group from which they came: a male who weighs 1500 g or a female who weighs 1500 g? Since the z score for the male is z = weight that is more extreme. (Round to two decimal places.) and the z score for the female is z = the has the female malearrow_forwardA sample has a mean of M=60 and a standard deviation of s=7. For this sample, find the z-score for each of the following X values. x=69 x=54 x-72 x=49 x=63 x=52arrow_forward
- Use z scores to compare the given values. Based on sample data, newborn males have weights with a mean of 3266.3g and a standard deviation of 851.1g. Newborn females have weights with a mean of 3027.4 g and a standard deviation of 563.5 g. Who has the weight that is more extreme relative to the group from which they came: a male who weighs 1600g or a female who weighs 1600 g? Since the z score for the male is z= _______and the z score for the female is z=_____, the (female,male) has the weight that is more extreme. (Round to two decimal places.)arrow_forwarda population of scores has u=44. in this population a score of x=40 corresponds to z = -1.00. What is the population standard deviation?arrow_forwardFor a sample with a standard deviation of s=4, a score of X=35 corresponds to Z= -1.25. what is the sample mean?arrow_forward
- A population of scores has µ=44. In this population, a score of X= 40 corresponds to z= - 0. 50. What is the population standard deviation?arrow_forwardUse z scores to compare the given values. Based on sample data, newborn males have weights with mean of 3204.8 g and a standard deviation of 770.8 g. Newborn females have weights with a mean of 3066.5 g and a standard deviation of 585.9 g. Who has the weight that is more extreme relative to the group from which they came: a male who weighs 1600 g or a female who weighs 1600 g? Since the z score for the male is z= and the z score for the female is z= the V has the weight that is more extreme. (Round to two decimal places.)arrow_forwardFor a population with a mean of u=45, a score of X=54 corresponds to z=1.50. What is the population standard deviation?arrow_forward
arrow_back_ios
SEE MORE QUESTIONS
arrow_forward_ios
Recommended textbooks for you
- MATLAB: An Introduction with ApplicationsStatisticsISBN:9781119256830Author:Amos GilatPublisher:John Wiley & Sons Inc
 Probability and Statistics for Engineering and th...StatisticsISBN:9781305251809Author:Jay L. DevorePublisher:Cengage Learning
 Statistics for The Behavioral Sciences (MindTap C...StatisticsISBN:9781305504912Author:Frederick J Gravetter, Larry B. WallnauPublisher:Cengage Learning
  Elementary Statistics: Picturing the World (7th E...StatisticsISBN:9780134683416Author:Ron Larson, Betsy FarberPublisher:PEARSON
 The Basic Practice of StatisticsStatisticsISBN:9781319042578Author:David S. Moore, William I. Notz, Michael A. FlignerPublisher:W. H. Freeman
 Introduction to the Practice of StatisticsStatisticsISBN:9781319013387Author:David S. Moore, George P. McCabe, Bruce A. CraigPublisher:W. H. Freeman
MATLAB: An Introduction with Applications
Statistics
ISBN:9781119256830
Author:Amos Gilat
Publisher:John Wiley & Sons Inc
Probability and Statistics for Engineering and th...
Statistics
ISBN:9781305251809
Author:Jay L. Devore
Publisher:Cengage Learning
Statistics for The Behavioral Sciences (MindTap C...
Statistics
ISBN:9781305504912
Author:Frederick J Gravetter, Larry B. Wallnau
Publisher:Cengage Learning
Elementary Statistics: Picturing the World (7th E...
Statistics
ISBN:9780134683416
Author:Ron Larson, Betsy Farber
Publisher:PEARSON
The Basic Practice of Statistics
Statistics
ISBN:9781319042578
Author:David S. Moore, William I. Notz, Michael A. Fligner
Publisher:W. H. Freeman
Introduction to the Practice of Statistics
Statistics
ISBN:9781319013387
Author:David S. Moore, George P. McCabe, Bruce A. Craig
Publisher:W. H. Freeman