
MATLAB: An Introduction with Applications
6th Edition
ISBN: 9781119256830
Author: Amos Gilat
Publisher: John Wiley & Sons Inc
expand_more
expand_more
format_list_bulleted
Related questions
Question
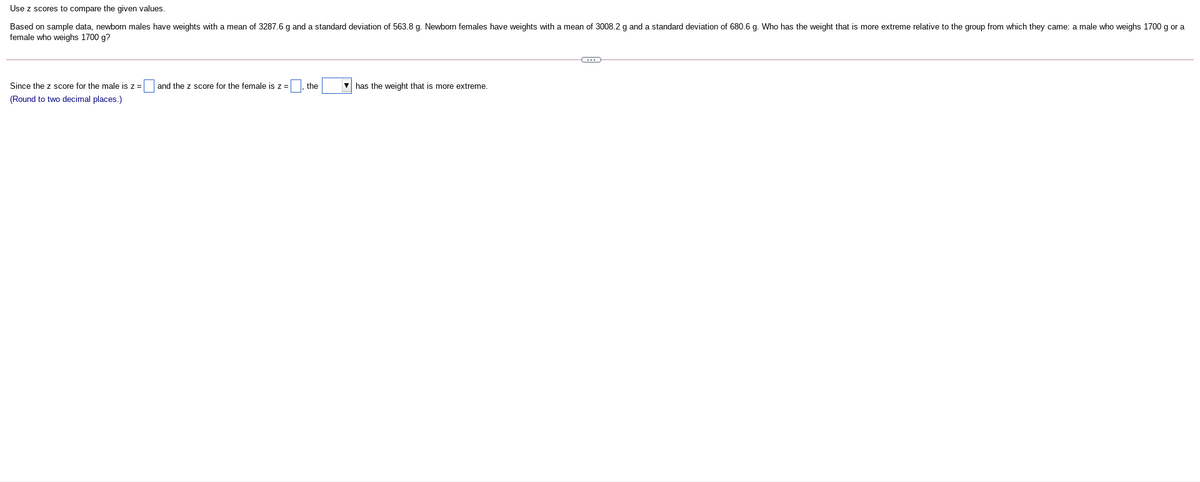

Transcribed Image Text:Use z scores to compare the given values.
Based on sample data, newborn males have weights with a mean of 3287.6 g and a standard deviation of 563.8 g. Newborn females have weights with a mean of 3008.2 g and a standard deviation of 680.6 g. Who has the weight that is more extreme relative to the group from which they came: a male who weighs 1700 g or a
female who weighs 1700 g?
Since the z score for the male is z =
and the z score for the female is z =
the
V has the weight that is more extreme.
(Round to two decimal places.)
Expert Solution
arrow_forward
Step 1
Consider that the mean and standard deviation of a random variable x are x̄ and s, respectively.
Thus, the z-score of that random variable x is z = (x – x̄)/s.

Trending nowThis is a popular solution!

Step by stepSolved in 2 steps

Knowledge Booster

Similar questions
- Answer the question by recalling significantly low or high values based on standard deviation. Focus groups of 11 people are randomly selected to discuss products of the Yummy Company. It is determined that the mean number (per group) who recognize the Yummy brand name is 7.8, and the standard deviation is 0.97. Would it be significantly low to randomly select 11 people and find that fewer than 4 recognize the Yummy brand name?arrow_forwardcompare ihe altenuance al lNe res for a Saturday evening performance. He knows the mean and standard deviations for each theatre's usual attendance. Since the theatres have different seating capacity, he wants to use their relative measure of attendance as the basis for comparison. Using the information in the table below, which theatre has the relatively better attendance for a Saturday evening performance? Goodman Steppenwolf 454 Attendance 417 Mean St.dev. 383 34 438 20 a) What is Goodman's z-score? b) What is Steppenwolf's z-score? c) Which has better attendance?arrow_forwardA population has a mean 75 and standard deviation 12. a. A random sample of 125 are taken. Find the mean and the standard deviation of the sample mean. b. How would the answer to part (a) change if the size of the sample were 500 instead of 125?arrow_forward
- 3. Use the following information about the heights measured in feet of a sample of 40 Ponderosa Pine trees and 40 Eastern White Pine trees. Ponderosa Pine Trees: Mean of 77.5 ft with a standard deviation of 11.55 ft Eastern White Pine Trees: Mean of 67.25 ft with a standard deviation of 10.33 ft Is it more unusual for a Ponderosa Pine tree to have a height of 71 ft or an Eastern White Pine tree to have a height of 71 ft relative to the data of each species of tree? Use z-scores to explain your solution.arrow_forwardThe University of Montana admission standards require students to have an ACT score of at least 22. We know that Montana ACT scores are normally distributed with a mean of 20.1 and a standard deviation of 4. A: Students in Oregon have a mean ACT score of 21.1 with a standard deviation of 2.8. If we chose one student each at random from Oregon and from Montana, which student would be more likely to meet the ACT requirements of the University of Montana? Explain your answer using the appropriate statistics and a correctly labeled and shaded normal distribution. B: We know that the Montana ACT scores are normally distributed with a mean of 20.1 and a standard deviation of 4. Assume that the top 2% of individuals in the state are eligible for a state-funded scholarship. What score does an individual need on the ACT to be eligible? Explain your answer using the appropriate statistics and a correctly labeled and shaded normal distributionarrow_forwardThe average McDonald's restaurant generates $3.6 million in sales each year with a standard deviation of 0.9. Trent wants to know if the average sales generated by McDonald's restaurants in Kentucky is different than the worldwide average. He surveys 27 restaurants in Kentucky and finds the following data (in millions of dollars): 4.1, 2.8, 4.4, 4.5, 5.3, 5, 3.7, 2.9, 3.8, 4.8, 3.6, 2.3, 3.7, 2.9, 2.9, 4, 1.1, 5.2, 2.9, 5, 4, 4, 5.9, 3.2, 2.2, 4.3, 3.8 Perform a hypothesis test using a 3% level of significance. Step 1: State the null and alternative hypotheses. Ho: [? v] ? v На: ? ? v (So we will be performing a Select an answer test.) Step 2: Assuming the null hypothesis is true, determine the features of the distribution of point estimates using the Central Limit Theorem. By the Central Limit Theorem, we know that the point estimates are Select an answer v with distribution mean and distribution standard deviation Step 3: Find the p-value of the point estimate. P( ? v ? v = P( ? ♥ ?…arrow_forward
- Five students took a self-confidence test. Their deviation scores were –4, +3, +1, –2, and +2. Assuming that these scores com form a normaldistribution, which deviation represents the highest raw score?arrow_forwardChoose the correct option and explain.arrow_forwardThe systolic blood pressure of adults in the USA is nearly normally distributed with a mean of 122 and standard deviation of 24 . Someone qualifies as having Stage 2 high blood pressure if their systolic blood pressure is 160 or higher. a. Around what percentage of adults in the USA have stage 2 high blood pressure? b. If you sampled 1000 people, how many would you expect to have BP> 160? Give your answer to the nearest person. people c. Stage 1 high BP is specified as systolic BP between 140 and 160. What percentage of adults in the US qualify for stage 1?arrow_forward
- Researchers collected information on the body parts of a new species of frog. The thumb length for the female frog has a mean of 8.04 mm and a standard deviation of 0.54 mm. Let x denote thumb length for a female specimen. a. Find the standardized version of x. b. Determine and interpret the z-scores for thumb lengths of 8.8 mm and 7.3 mm. Round your answers to two decimal places. a. Find the standardized version of x. X- 8.04 0.54 (Do not simplify. Use integers or decimals for any numbers in the expression. Do not round.) b. Determine and interpret the z-scores for thumb lengths of 8.8 mm and 7.3 mm. Round your answers to two decimal places. Determine and interpret the z-score for a thumb length of 8.8 mm. The z-score for a thumb length of 8.8 is |. This is standard deviations the mean thumb length. (Round to two decimal places as needed.)arrow_forwardIs it worth pursuing a doctoral degree in education if you already have an undergraduate degree? One way to help make this decision is to look at the mean incomes of these two groups. Suppose that 15 people with bachelor’s degrees in education were surveyed. Their mean annual salary was $31,500 with a standard deviation of $7900. Seventeen people with doctoral degrees in education were found to have a mean annual salary of $47,500 with a standard deviation of $6900. Assume that the population variances are not the same. Construct a 99% confidence interval to estimate the true difference between the mean salaries for people with doctoral degrees and undergraduate degrees in education. Let Population 1 be the salaries for people with doctoral degrees and Population 2 be the salaries for people with undergraduate degrees. Round the endpoints of the interval to the nearest whole number, if necessary.arrow_forwardAn IQ test has a mean of 96 and a standard deviation of 15. Which is more unusual, an IQ of 81 or an IQ of 120?arrow_forward
arrow_back_ios
SEE MORE QUESTIONS
arrow_forward_ios
Recommended textbooks for you
- MATLAB: An Introduction with ApplicationsStatisticsISBN:9781119256830Author:Amos GilatPublisher:John Wiley & Sons Inc
 Probability and Statistics for Engineering and th...StatisticsISBN:9781305251809Author:Jay L. DevorePublisher:Cengage Learning
 Statistics for The Behavioral Sciences (MindTap C...StatisticsISBN:9781305504912Author:Frederick J Gravetter, Larry B. WallnauPublisher:Cengage Learning
  Elementary Statistics: Picturing the World (7th E...StatisticsISBN:9780134683416Author:Ron Larson, Betsy FarberPublisher:PEARSON
 The Basic Practice of StatisticsStatisticsISBN:9781319042578Author:David S. Moore, William I. Notz, Michael A. FlignerPublisher:W. H. Freeman
 Introduction to the Practice of StatisticsStatisticsISBN:9781319013387Author:David S. Moore, George P. McCabe, Bruce A. CraigPublisher:W. H. Freeman
MATLAB: An Introduction with Applications
Statistics
ISBN:9781119256830
Author:Amos Gilat
Publisher:John Wiley & Sons Inc
Probability and Statistics for Engineering and th...
Statistics
ISBN:9781305251809
Author:Jay L. Devore
Publisher:Cengage Learning
Statistics for The Behavioral Sciences (MindTap C...
Statistics
ISBN:9781305504912
Author:Frederick J Gravetter, Larry B. Wallnau
Publisher:Cengage Learning
Elementary Statistics: Picturing the World (7th E...
Statistics
ISBN:9780134683416
Author:Ron Larson, Betsy Farber
Publisher:PEARSON
The Basic Practice of Statistics
Statistics
ISBN:9781319042578
Author:David S. Moore, William I. Notz, Michael A. Fligner
Publisher:W. H. Freeman
Introduction to the Practice of Statistics
Statistics
ISBN:9781319013387
Author:David S. Moore, George P. McCabe, Bruce A. Craig
Publisher:W. H. Freeman