
MATLAB: An Introduction with Applications
6th Edition
ISBN: 9781119256830
Author: Amos Gilat
Publisher: John Wiley & Sons Inc
expand_more
expand_more
format_list_bulleted
Related questions
Question
![Student Year in College Course Work Hours per Class
Freshman (1)
2
Sophomore (2)
3
Junior (3)
4
4
Senior (4)
A scatterplot of the sample data follows [blue points (circle symbols)]. The line Y = 8 - X is also
HOURS
10
O Sum of Distances
8 0
(x-bar, y-bar))
х
5
YEAR
Clear All
2.
2.](https://content.bartleby.com/qna-images/question/be746ac3-3ec7-4bff-8d75-7ef96722aa72/356c1128-8143-4e6a-bdff-3621aa118486/a2zv78k.png)

Transcribed Image Text:Student Year in College Course Work Hours per Class
Freshman (1)
2
Sophomore (2)
3
Junior (3)
4
4
Senior (4)
A scatterplot of the sample data follows [blue points (circle symbols)]. The line Y = 8 - X is also
HOURS
10
O Sum of Distances
8 0
(x-bar, y-bar))
х
5
YEAR
Clear All
2.
2.
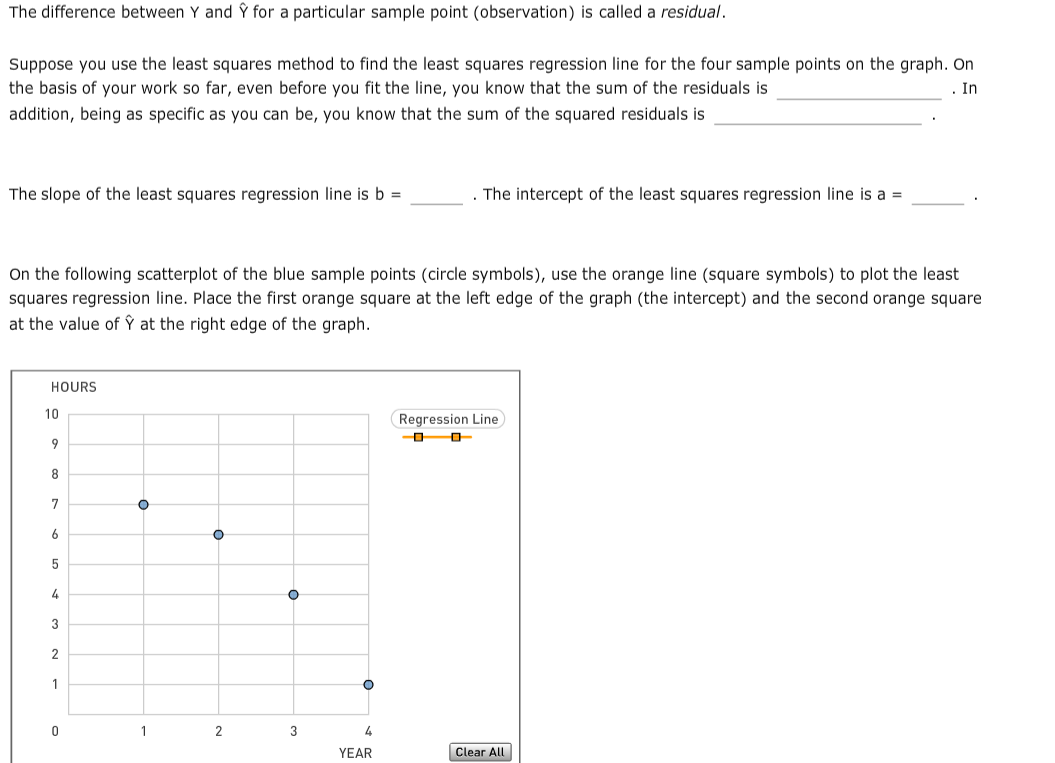
Transcribed Image Text:The difference between Y and Ỹ for a particular sample point (observation) is called a residual.
Suppose you use the least squares method to find the least squares regression line for the four sample points on the graph. On
the basis of your work so far, even before you fit the line, you know that the sum of the residuals is
. In
addition, being as specific as you can be, you know that the sum of the squared residuals is
The slope of the least squares regression line is b =
. The intercept of the least squares regression line is a =
On the following scatterplot of the blue sample points (circle symbols), use the orange line (square symbols) to plot the least
squares regression line. Place the first orange square at the left edge of the graph (the intercept) and the second orange square
at the value of Ý at the right edge of the graph.
HOURS
10
Regression Line
3
1
3
4.
YEAR
Clear All
Expert Solution
This question has been solved!
Explore an expertly crafted, step-by-step solution for a thorough understanding of key concepts.

This is a popular solution

Trending nowThis is a popular solution!

Step by stepSolved in 6 steps with 4 images

Knowledge Booster

Similar questions
- The estimated regression line: a. does not change the sum of squared residuals.b. maximizes the sum of squared residuals.c. minimizes the sum of squared residuals.d. sometimes maximizes and sometimes minimizes the sum of squared residuals.can you also explain the answer, pleasearrow_forwardAnswer the following: 2. Describe the form, direction, and strength of the relationship between these variables. Does there appear to be any outliers? 3. The equation of least-squares regression line is y = 6.871 + 0.061x. This line goes through the points (0, 6.9) and (700, 49.5). Use these points to add the regression line to your scatterplot above. 4. One animal is farthest from the regression line and is an outlier for these two variables. Find the name of this animal and write a sentence describing how its position differs from the overall relationship among the other animals. 5. The elephant has the longest gestation period of these animals. a. Considering only the gestation variable, would you say that the elephant is an outlier? Write a sentence or two explaining why or why not? b. Considering both variables and the relationship between average life span and average gestation period, would you say the elephant is an outlier now? Write a sentence or two explaining why or why…arrow_forwardA medical experiment on tumor growth gives the following data table. X: 65, 70, 86, 100, 222. Y: 33, 35, 45, 52, 70. The least squares regression line was found. Using technology, it is determined that the total sum of squares (SST) was 898 and the sum of squares of regression (SSR) was 806.2. Calculate R2, rounded to three decimal placesarrow_forward
- Consider the set of points (0,9),(1,5),(6,3) and (9,2). In this set of points, the age of a dolphin is the first part of each ordered pair and the second part is the number of tricks that the dolphin learned in a month. So, the 6 year-old dolphin learned 3 tricks in the month. Write the least squares regression line for this data. Use the line to estimate how many tricks a 4 year-old dolphin could learn. Then find r and r2. Explain what r2 means.arrow_forwardAn engineer wants to determine how the weight of a gas-powered car, x, affects gas mileage, y. The accompanying data represent the weights of various domestic cars and their miles per gallon in the city for the most recent model year. Complete parts (a) through (d) below. (a) Find the least-squares regression line treating weight as the explanatory variable and miles per gallon as the response variable. y=nothingx+(nothing) (Round the x coefficient to five decimal places as needed. Round the constant to one decimal place as needed.) (b) Interpret the slope and y-intercept, if appropriate. Choose the correct answer below and fill in any answer boxes in your choice. (Use the answer from part a to find this answer.) A. A weightless car will get nothing miles per gallon, on average. It is not appropriate to interpret the slope. B. For every pound added to the weight of the car, gas mileage in the city will decrease by nothing mile(s) per gallon, on…arrow_forwardMight we be able to predict life expectancies from birthrates? Below are bivariate data giving birthrate and life expectancy information for each of twelve countries. For each of the countries, both x, the number of births per one thousand people in the population, and y, the female life expectancy (in years), are given. Also shown are the scatter plot for the data and the least-squares regression line. The equation for this line is y=82.25 -0.48x. ^ Birthrate, x (number of births per 1000 people) 35.5 44.9 29.7 19.9 13.7 27.0 51.9 15.0 50.9 49.7 39.6 24.4 Send data to calculator Send data to Excel Female life expectancy, y (in years) 67.9 57.9 61.7 71.4 72.5 73.5 55.4 76.5 58.2 60.6 64.4 74.4 Based on the sample data and the regression line, complete the following. Female life expectancy (in years) 85 80+ 75+ 70- 65+ 60- 55+ 50 x X x ++ 10 15 20 25 (b) According to the regression equation, for an increase of one (birth per 1000 people) in birthrate, there is a corresponding decrease…arrow_forward
- Weight (pounds), x Miles per Gallon, y 3769 18 3937 15 2662 24 3612 18 3347 20 2917 24 3640 17 2668 24 3381 18 3880 17 3286 19arrow_forwardThis is only one questionarrow_forwardIs It Getting Harder to Win a Hot Dog Eating Contest?Every Fourth of July, Nathan’s Famous in New York City holds a hot dog eating contest. The table below shows the winning number of hot dogs and buns eaten every year from 2002 to 2015, and the data are also available in HotDogs. The figure below shows the scatterplot with the regression line. Year Hot Dogs 2015 62 2014 61 2013 69 2012 68 2011 62 2010 54 2009 68 2008 59 2007 66 2006 54 2005 49 2004 54 2003 45 2002 50 Winning number of hot dogs in the hot dog eating contest Winning number of hot dogs and buns Click here for the dataset associated with this question. (a) Is the trend in the data mostly positive or negative? Positive Negative (b) Using the figure provided, is the residual larger in 2007 or 2008?Choose the answer from the menu in accordance to item (b) of the question statement 20072008 Is the residual positive or…arrow_forward
- Might we be able to predict life expectancies from birthrates? Below are bivariate data giving birthrate and life expectancy information for each of twelve countries. For each of the countries, both x, the number of births per one thousand people in the population, and y, the female life expectancy (in years), are given. Also shown are the scatter plot for the data and the least-squares regression line. The equation for this line is y = 82.17 -0.47x. Birthrate, x (number of births per 1000 people) 14.3 27.4 51.1 46.8 24.9 29.9 18.2 41.6 49.4 14.1 33.9 49.3 Send data to calculator Female life expectancy, y (in years) 75.6 70.5 58.2 59.0 73.3 62.7 73.6 65.2 62.4 74.3 67.0 53.9 Send data to Excel Female life expectancy (In years) Based on the sample data and the regression line, answer the following. 85+ 80+ 75+ 70+ 65 60 55+ 50 (a) From the regression equation, what is the predicted female life expectancy (in years) when the birthrate is 29.9 births per 1000 people? Round your answer to…arrow_forwardThe defending attorney Mr. Justin Case was interested in how a lengthy trial could affect howlong a jury would deliberate on a case (and see if he should just cut to the chase). He observed asample of courtroom trials and noticed the following:Days inTrial (X) 5 2 6 4 5 6 2 4 2 1 HoursDeliberation (Y) 4 4 1 3 1 3 9 2 3 7 1) What is the slope of the regression line?arrow_forwardFor major league baseball teams, do higher player payrolls mean more gate money? Here are data for each of the American League teams in the year 2002. The variable x denotes the player payroll (in millions of dollars) for the year 2002, and the variable y denotes the mean attendance (in thousands of fans) for the 81 home games that year. The data are plotted in the scatter plot below, as is the least-squares regression line. The equation for this line is y = 11.43 + 0.23x. Player payroll, x (in Mean attendance, y (in $1,000,000s) thousands) Anaheim 62.8 28.52 Baltimore 56.5 33.09 40- Boston 110.2 32.72 35 Chicago White Sox 54.5 20.74 30- Cleveland 74.9 32.35 25- Detroit 54.4 18.52 Kansas City 49.4 16.30 15- Minnesota 41.3 23.70 10+ New York Yankees 133.4 42.84 Oakland 41.9 26.79 20 40 60 80 100 120 140 Seattle 86.1 43.70 Player payroll, Тarmpa Bay 34.7 13.21 X (in $1,000,000s) Техas 106.9 29.01 Toronto 66.8 20.25 Send data to calculator Send data to Excel Based on the sample data and…arrow_forward
arrow_back_ios
SEE MORE QUESTIONS
arrow_forward_ios
Recommended textbooks for you
- MATLAB: An Introduction with ApplicationsStatisticsISBN:9781119256830Author:Amos GilatPublisher:John Wiley & Sons Inc
 Probability and Statistics for Engineering and th...StatisticsISBN:9781305251809Author:Jay L. DevorePublisher:Cengage Learning
 Statistics for The Behavioral Sciences (MindTap C...StatisticsISBN:9781305504912Author:Frederick J Gravetter, Larry B. WallnauPublisher:Cengage Learning
  Elementary Statistics: Picturing the World (7th E...StatisticsISBN:9780134683416Author:Ron Larson, Betsy FarberPublisher:PEARSON
 The Basic Practice of StatisticsStatisticsISBN:9781319042578Author:David S. Moore, William I. Notz, Michael A. FlignerPublisher:W. H. Freeman
 Introduction to the Practice of StatisticsStatisticsISBN:9781319013387Author:David S. Moore, George P. McCabe, Bruce A. CraigPublisher:W. H. Freeman
MATLAB: An Introduction with Applications
Statistics
ISBN:9781119256830
Author:Amos Gilat
Publisher:John Wiley & Sons Inc
Probability and Statistics for Engineering and th...
Statistics
ISBN:9781305251809
Author:Jay L. Devore
Publisher:Cengage Learning
Statistics for The Behavioral Sciences (MindTap C...
Statistics
ISBN:9781305504912
Author:Frederick J Gravetter, Larry B. Wallnau
Publisher:Cengage Learning
Elementary Statistics: Picturing the World (7th E...
Statistics
ISBN:9780134683416
Author:Ron Larson, Betsy Farber
Publisher:PEARSON
The Basic Practice of Statistics
Statistics
ISBN:9781319042578
Author:David S. Moore, William I. Notz, Michael A. Fligner
Publisher:W. H. Freeman
Introduction to the Practice of Statistics
Statistics
ISBN:9781319013387
Author:David S. Moore, George P. McCabe, Bruce A. Craig
Publisher:W. H. Freeman