MATLAB: An Introduction with Applications
6th Edition
ISBN: 9781119256830
Author: Amos Gilat
Publisher: John Wiley & Sons Inc
expand_more
expand_more
format_list_bulleted
Question
thumb_up100%
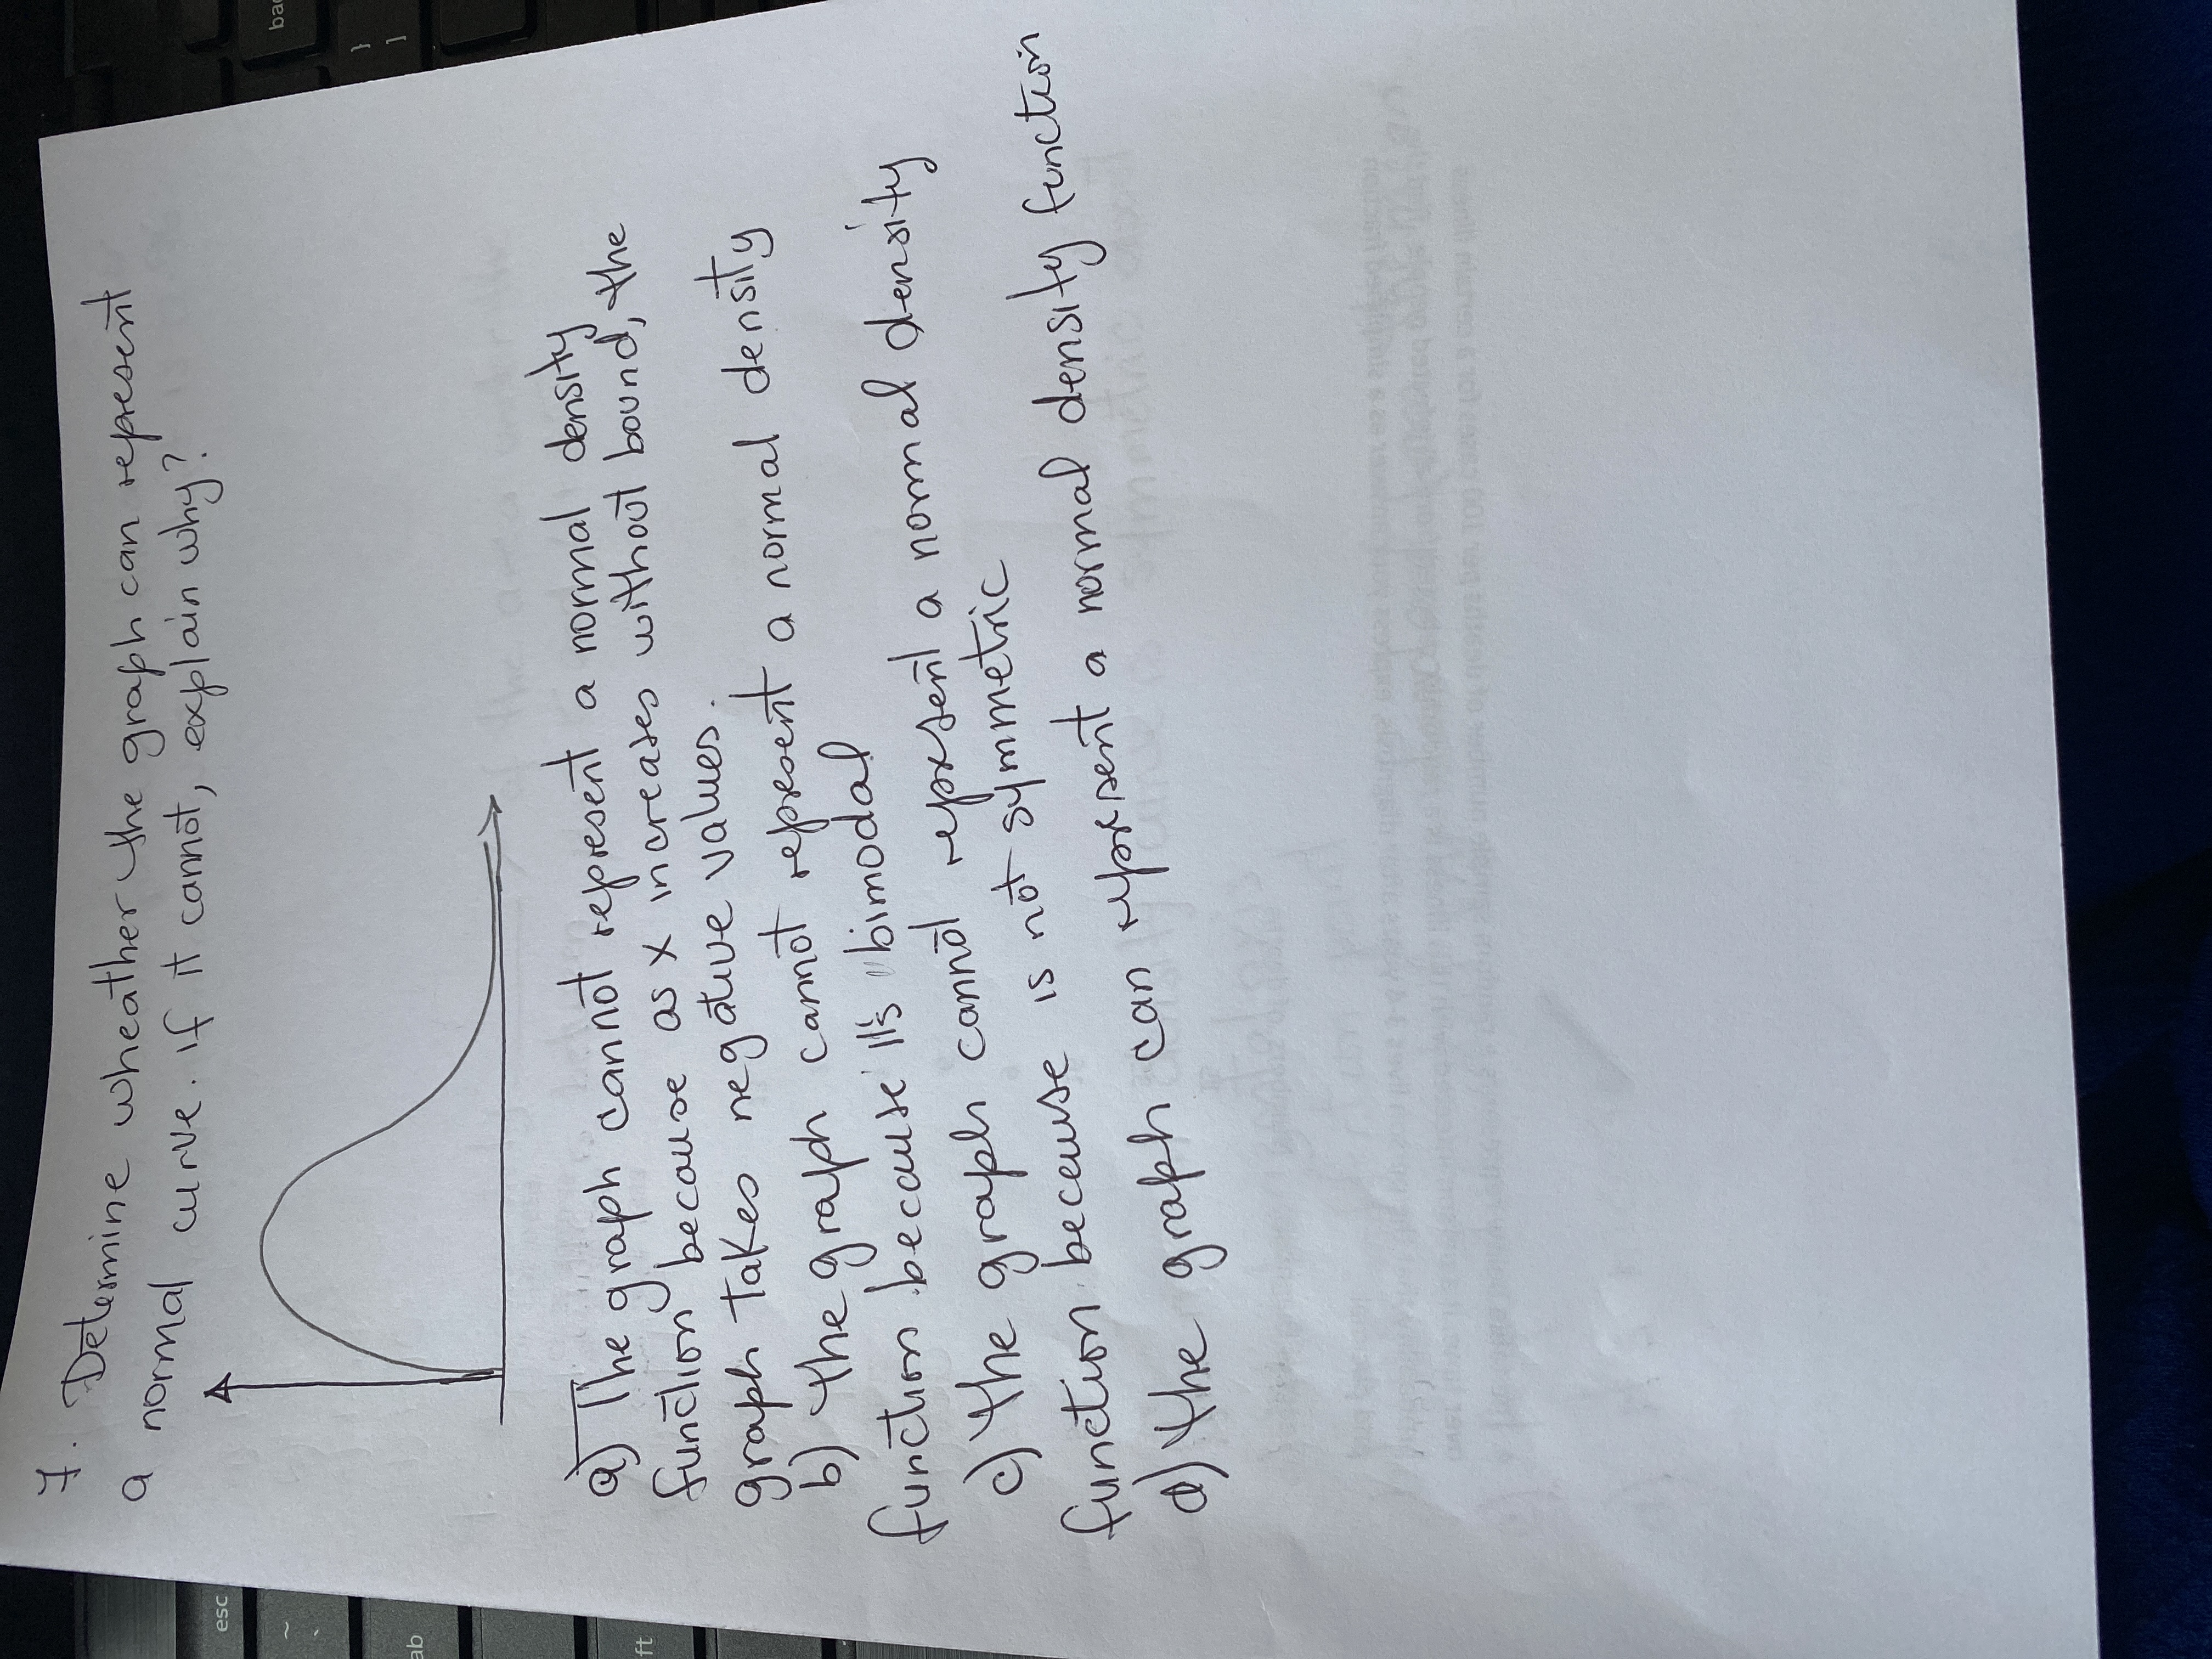
Determine wheaten the graph can represent a normal curve, if it cannot explain why ?

Expert Solution
arrow_forward
Step 1
A normal distribution is a continuous distribution and it has so many application in the real world.
Trending nowThis is a popular solution!
Step by stepSolved in 2 steps

Knowledge Booster
Learn more about
Need a deep-dive on the concept behind this application? Look no further. Learn more about this topic, statistics and related others by exploring similar questions and additional content below.Similar questions
- An outlier is a data point that may be an abnormal result should sometimes be left out of a statistical analysis may significantly affect the calculation of the correlation all of the abovearrow_forwardAnswer these questionarrow_forwardScores on the verbal Graduate Record Exam (GRE) are normally distributed with a mean of 600 and a standard deviation of 120. Using your graph in part (b), what percentage of students is expected to score between 480 and 840? Answer: _______________ % In a sample of 1500 students, how many are expected to score less than or equal to 360? Use your graph in part (b). Answer: _______________ students (Round to the nearestarrow_forward
- PLEASE i need serious help with number 2&3 please help with both write the answer clear and easy to understand pleasearrow_forwardThe graph of a normal curve is given. Use the graph to identify the value of u and o. X -6 -4 -2 4 6 8 10 ..... The value of u is The value of o isarrow_forwardDetermine whether the following graph can represent a normal cu bok G Could the graph represent a normal curve? Select all that applyarrow_forward
- The graph of a normal curve is given. Use the graph to identify the value of u and o. 518 521 524 527 530 533 536 539 542 The value of u is The value of o isarrow_forwardCORRI Is there a correlation between hours slept and performance on Dr. Corvers Statistics exam? Please calculate both R and interpret. IS THERE A CORRELATION? DO ALL STEPS AND CALCULATIONS THAT YOU WERE SHOWN IN CLASS Hours Slept (X) Number of Items missed on the final exam(Y) 9. 10 9 1 11 1arrow_forwardThe graph of a normal curve is given. Use the graph to identify the value of u and o. X -4 -1 2 8 11 14 17 ..... The value of u is The value of o isarrow_forward
- is a scatterplot with RSquared equal to 0.022418 and Root Mean Square error equal to 2.422091 a good model and what do those two valus tell you about the graph. Picture of scatter plot attached.arrow_forwardI am unsure how to label this graph, can someone help explain how to label it? Thank you.arrow_forwardPage < of 21 9. Vending Machine. A vending machine dispenses coffee into an 8-ounce cup. The amount of coffee dispensed into the cup is normally distributed with a standard deviation of 0.03 ounces. You can allow the cup to overfill 1% of the time. What amount should you set as the mean amount of coffee to be dispensed? Draw, shade and label a normal curve to illustrate your results.arrow_forward
arrow_back_ios
SEE MORE QUESTIONS
arrow_forward_ios
Recommended textbooks for you
 MATLAB: An Introduction with ApplicationsStatisticsISBN:9781119256830Author:Amos GilatPublisher:John Wiley & Sons Inc
 Probability and Statistics for Engineering and th...StatisticsISBN:9781305251809Author:Jay L. DevorePublisher:Cengage Learning
 Statistics for The Behavioral Sciences (MindTap C...StatisticsISBN:9781305504912Author:Frederick J Gravetter, Larry B. WallnauPublisher:Cengage Learning
 Elementary Statistics: Picturing the World (7th E...StatisticsISBN:9780134683416Author:Ron Larson, Betsy FarberPublisher:PEARSON
 The Basic Practice of StatisticsStatisticsISBN:9781319042578Author:David S. Moore, William I. Notz, Michael A. FlignerPublisher:W. H. Freeman
 Introduction to the Practice of StatisticsStatisticsISBN:9781319013387Author:David S. Moore, George P. McCabe, Bruce A. CraigPublisher:W. H. Freeman

MATLAB: An Introduction with Applications
Statistics
ISBN:9781119256830
Author:Amos Gilat
Publisher:John Wiley & Sons Inc

Probability and Statistics for Engineering and th...
Statistics
ISBN:9781305251809
Author:Jay L. Devore
Publisher:Cengage Learning

Statistics for The Behavioral Sciences (MindTap C...
Statistics
ISBN:9781305504912
Author:Frederick J Gravetter, Larry B. Wallnau
Publisher:Cengage Learning

Elementary Statistics: Picturing the World (7th E...
Statistics
ISBN:9780134683416
Author:Ron Larson, Betsy Farber
Publisher:PEARSON

The Basic Practice of Statistics
Statistics
ISBN:9781319042578
Author:David S. Moore, William I. Notz, Michael A. Fligner
Publisher:W. H. Freeman

Introduction to the Practice of Statistics
Statistics
ISBN:9781319013387
Author:David S. Moore, George P. McCabe, Bruce A. Craig
Publisher:W. H. Freeman