MATLAB: An Introduction with Applications
6th Edition
ISBN: 9781119256830
Author: Amos Gilat
Publisher: John Wiley & Sons Inc
expand_more
expand_more
format_list_bulleted
Question

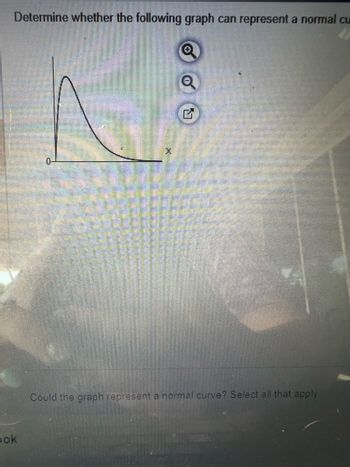
Transcribed Image Text:Determine whether the following graph can represent a normal cu
bok
G
Could the graph represent a normal curve? Select all that apply

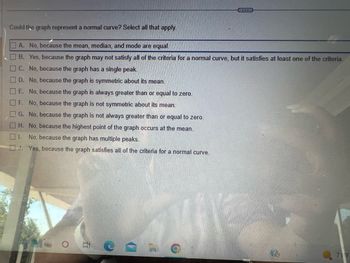
Transcribed Image Text:Could the graph represent a normal curve? Select all that apply.
A. No, because the mean, median, and mode are equal.
B. Yes, because the graph may not satisfy all of the criteria for a normal curve, but it satisfies at least one of the criteria.
C. No, because the graph has a single peak.
D. No, because the graph is symmetric about its mean.
0 0 0 0 0 0
E. No, because the graph is always greater than or equal to zero.
F. No, because the graph is not symmetric about its mean.
No, because the graph is not always greater than or equal to zero.
H. No, because the highest point of the graph occurs at the mean.
G.
I. No, because the graph has multiple peaks.
J. Yes, because the graph satisfies all of the criteria for a normal curve.
C
71 F
Expert Solution
This question has been solved!
Explore an expertly crafted, step-by-step solution for a thorough understanding of key concepts.
This is a popular solution
Trending nowThis is a popular solution!
Step by stepSolved in 2 steps

Knowledge Booster
Similar questions
- It is possible for the value of the median to be greater that the value of the mode. a. True b. Falsearrow_forward2. What does it mean for a scatter plot to have a negative trend? O A. Higher c-values tend to go with higher y-values. OB. Higher -values tend to go with lower y-values. OC. The x- and y-values appear to be unrelated. OD. None of these are true.arrow_forwardWhich of the following statements about in-control and out-of-control processes is (are) true? I. The mean chart and range chart always show that processes are in control. II. A mean chart can be in control, while a range chart can be out of control. III. A mean chart can be out of control, while a range chart can be in control A. I only B. II only C. II and III D. I and IIIarrow_forward
- The results: A. Are, or B. Are not significantly: A. High, or B. Low so there: A. is, or B. is notarrow_forward1. The two plots have similar distrubutions. Are the distrubutions skewed left, approximtly symmetric, or skewed right? 2. Which is greater, the mean or the median, within each plot? Why does this make snese, gicen the type of distrubution you identified in the first part? 3. The population has drastically declined over recent years. Does the data show a difference in bee prefrence towards high quality hives versus how quality hives? Usse statistical evidennce to support your response.arrow_forwardPart 2. Complete the following statements. A) The cumulative enrolment is the enrolment of the intervals smaller than the interval in question or equal to the latter. The graph of cumulative enrolment is represented by a function in B) The average, median and mode are three measures of of the C) The term refers to any data that deviates disproportionately from others. D) When the residual values are zero, then the correlation is calledarrow_forward
- 5. Which of the following is the assumption that the best way to describe the pattern of data is using a straight line? homoscedasticity normality linearity restriction of rangearrow_forwardThe mean number of sick days an employee takes per year is believed to be about 10.5. Members of a personnel department do not believe this figure. They randomly survey ten employees. The number of sick days they took for the past year are as follows: 12; 4; 15; 3; 11; 8; 6; 8; 2; 9. Let x = the number of sick days they took for the past year. Should the personnel team believe that the mean number is ten?arrow_forward18arrow_forward
arrow_back_ios
arrow_forward_ios
Recommended textbooks for you
 MATLAB: An Introduction with ApplicationsStatisticsISBN:9781119256830Author:Amos GilatPublisher:John Wiley & Sons Inc
 Probability and Statistics for Engineering and th...StatisticsISBN:9781305251809Author:Jay L. DevorePublisher:Cengage Learning
 Statistics for The Behavioral Sciences (MindTap C...StatisticsISBN:9781305504912Author:Frederick J Gravetter, Larry B. WallnauPublisher:Cengage Learning
 Elementary Statistics: Picturing the World (7th E...StatisticsISBN:9780134683416Author:Ron Larson, Betsy FarberPublisher:PEARSON
 The Basic Practice of StatisticsStatisticsISBN:9781319042578Author:David S. Moore, William I. Notz, Michael A. FlignerPublisher:W. H. Freeman
 Introduction to the Practice of StatisticsStatisticsISBN:9781319013387Author:David S. Moore, George P. McCabe, Bruce A. CraigPublisher:W. H. Freeman

MATLAB: An Introduction with Applications
Statistics
ISBN:9781119256830
Author:Amos Gilat
Publisher:John Wiley & Sons Inc

Probability and Statistics for Engineering and th...
Statistics
ISBN:9781305251809
Author:Jay L. Devore
Publisher:Cengage Learning

Statistics for The Behavioral Sciences (MindTap C...
Statistics
ISBN:9781305504912
Author:Frederick J Gravetter, Larry B. Wallnau
Publisher:Cengage Learning

Elementary Statistics: Picturing the World (7th E...
Statistics
ISBN:9780134683416
Author:Ron Larson, Betsy Farber
Publisher:PEARSON

The Basic Practice of Statistics
Statistics
ISBN:9781319042578
Author:David S. Moore, William I. Notz, Michael A. Fligner
Publisher:W. H. Freeman

Introduction to the Practice of Statistics
Statistics
ISBN:9781319013387
Author:David S. Moore, George P. McCabe, Bruce A. Craig
Publisher:W. H. Freeman