
College Algebra (MindTap Course List)
12th Edition
ISBN: 9781305652231
Author: R. David Gustafson, Jeff Hughes
Publisher: Cengage Learning
expand_more
expand_more
format_list_bulleted
Related questions
Question
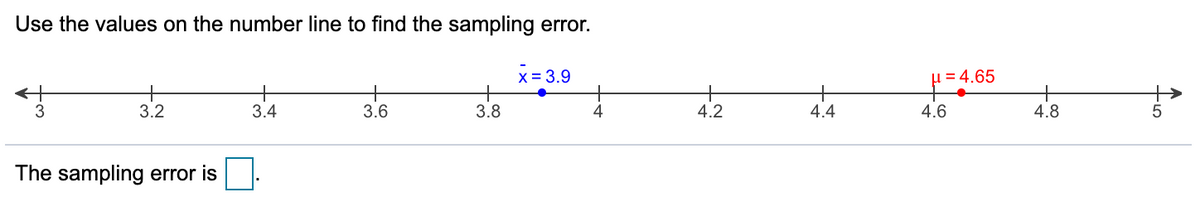

Transcribed Image Text:Use the values on the number line to find the sampling error.
x = 3.9
µ = 4.65
3.2
3.4
3.6
3.8
4
4.2
4.4
4.6
4.8
The sampling error is
Expert Solution
This question has been solved!
Explore an expertly crafted, step-by-step solution for a thorough understanding of key concepts.

This is a popular solution

Trending nowThis is a popular solution!

Step by stepSolved in 2 steps

Knowledge Booster

Similar questions
- Determine P(Z < 1.8). Use 6 decimal places in your final answer. Sample answer: 0.123456arrow_forwardPlease show your solution and answer within 40min thanks.arrow_forwardA large automobile insurance company selected samples of single and married male policyholders and recorded the number who made an insurance claim over the preceding three-year period. Single Policyholders Married Policyholders 350 1,000 Number making claims = 70 Number making claims = 150 a. Use l= 0.05 Test to determine whether the claim rates differ between single and married male policyholders. z-value (to 2 decimals) p-value (to 4 decimals) b. Provide a 95% confidence interval (to 4 decimals) for the difference between the proportions for the two populations. Enter negative answer as negative number.arrow_forward
- Assume the readings on thermometers are normally distributed with a mean of 0°C and a standard deviation of 1.00°C. Find the probability that a randomly selected thermometer reads between - 1.97 and - 0.51 and draw a sketch of the region. Sketch the region. Choose the correct graph below.arrow_forwardGiven the figure below, find P(AIC). Use three decimal places in your final answer. Sample Answer: 0.589 A В .02 (.03 .07 05 (.04.08 .20 .51arrow_forwardDetermine the point estimate of the population proportion for the sample provided. Lower bound: 0.152, Upper bound: 0.212, n=1000arrow_forward
- Assume that a randomly selected subject is given a bone density test. Those test scores are normally distributed with a mean of 0 and a standard deviation of 1. Find the probability that a given score is between -2.05 and 3.87 and draw a sketch of the region. Sketch the region. Choose the correct graph below. OA. OB. OC. OD. -2.05 3.87 2.05 3.87 -2.05 3.87 -2.05 3.87 The probability is (Round to four decimal places as needed.)arrow_forwardAssume that the population proportion is .55. Compute the standard error of the proportion, sp, for sample sizes of 100, 200, 500, and 1000. What can you say about the size ofthe standard error of the proportion as the sample size is increased?arrow_forwardFind the margin of error for the given values of c, σ, and n. c=0.90, σ=2.3, n=36 LOADING... Click the icon to view a table of common critical values. E=enter your response here (Round to three decimal plarrow_forward
arrow_back_ios
SEE MORE QUESTIONS
arrow_forward_ios
Recommended textbooks for you
- College Algebra (MindTap Course List)AlgebraISBN:9781305652231Author:R. David Gustafson, Jeff HughesPublisher:Cengage Learning
 Big Ideas Math A Bridge To Success Algebra 1: Stu...AlgebraISBN:9781680331141Author:HOUGHTON MIFFLIN HARCOURTPublisher:Houghton Mifflin Harcourt
 Glencoe Algebra 1, Student Edition, 9780079039897...AlgebraISBN:9780079039897Author:CarterPublisher:McGraw Hill
College Algebra (MindTap Course List)
Algebra
ISBN:9781305652231
Author:R. David Gustafson, Jeff Hughes
Publisher:Cengage Learning
Big Ideas Math A Bridge To Success Algebra 1: Stu...
Algebra
ISBN:9781680331141
Author:HOUGHTON MIFFLIN HARCOURT
Publisher:Houghton Mifflin Harcourt
Glencoe Algebra 1, Student Edition, 9780079039897...
Algebra
ISBN:9780079039897
Author:Carter
Publisher:McGraw Hill