
MATLAB: An Introduction with Applications
6th Edition
ISBN: 9781119256830
Author: Amos Gilat
Publisher: John Wiley & Sons Inc
expand_more
expand_more
format_list_bulleted
Related questions
Question
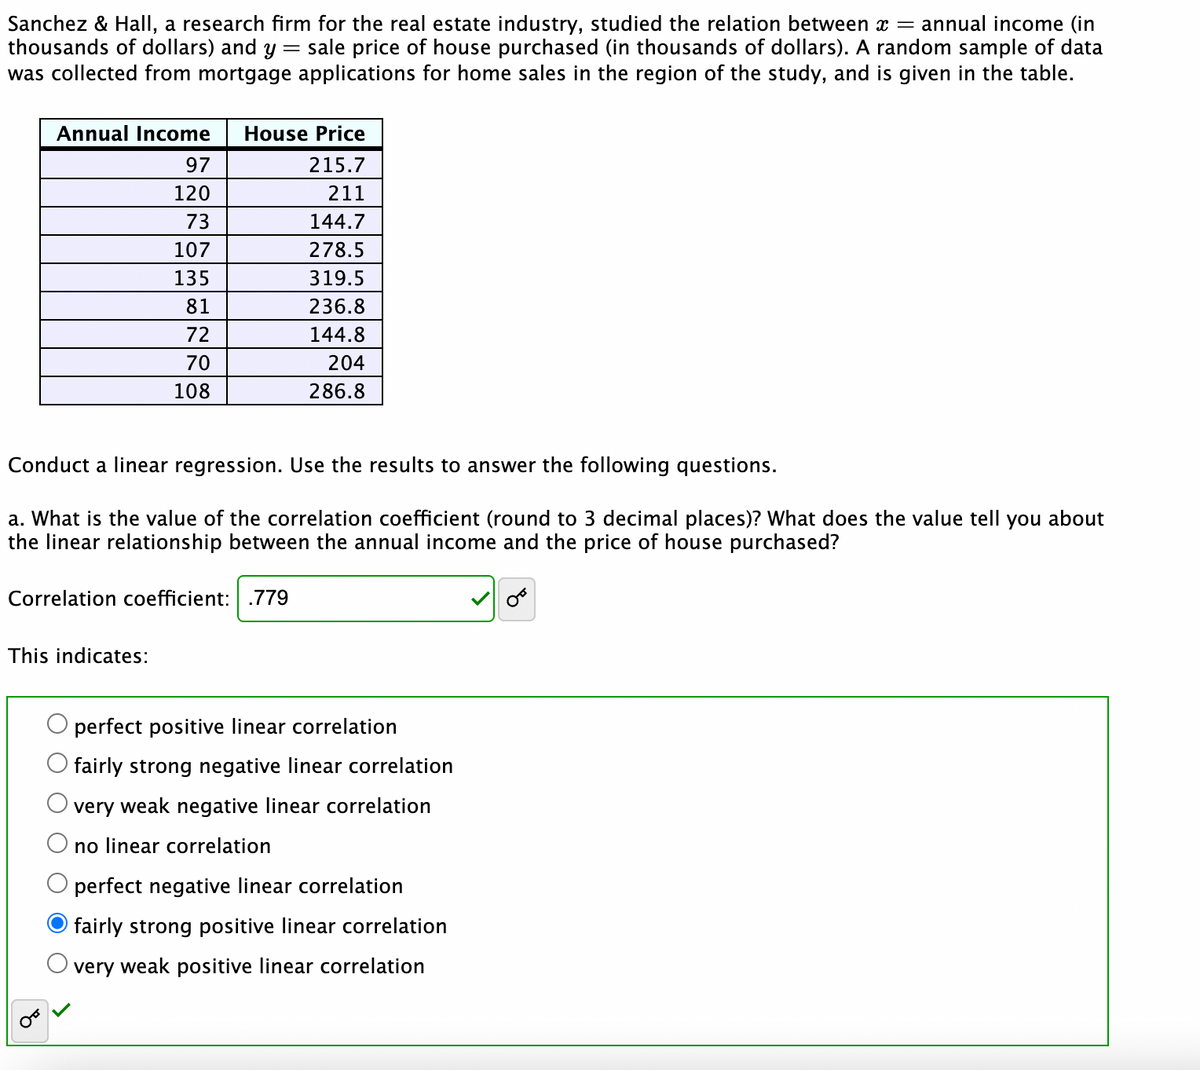

Transcribed Image Text:Sanchez & Hall, a research firm for the real estate industry, studied the relation between x = annual income (in
thousands of dollars) and y = sale price of house purchased (in thousands of dollars). A random sample of data
was collected from mortgage applications for home sales in the region of the study, and is given in the table.
Annual Income House Price
215.7
211
144.7
278.5
319.5
236.8
144.8
204
286.8
Conduct a linear regression. Use the results to answer the following questions.
a. What is the value of the correlation coefficient (round to 3 decimal places)? What does the value tell you about
the linear relationship between the annual income and the price of house purchased?
97
120
73
107
135
81
72
70
108
Correlation coefficient: .779
This indicates:
४
perfect positive linear correlation
fairly strong negative linear correlation
very weak negative linear correlation
no linear correlation
perfect negative linear correlation
O fairly strong positive linear correlation
very weak positive linear correlation

Transcribed Image Text:b. What is the equation of the Least Squares line? Round the parameter values (slope and y intercept) to 2
decimal places.
ŷ
--
33.44 +2.02x
c. If a buyer's annual income increases by $1000, the model's predicted change in DOLLARS of the sale price of
the house they will purchase is:
a(n) increase
(NOTE: be careful of UNITS!)
O of $ 2050.64
X
Expert Solution
arrow_forward
Step 1
Given
The data is as follows:
| Annual Income, x | House Price, y |
| 97 | 215.7 |
| 120 | 211 |
| 73 | 144.7 |
| 107 | 278.5 |
| 135 | 319.5 |
| 81 | 236.8 |
| 72 | 144.8 |
| 70 | 204 |
| 108 | 286.8 |

Trending nowThis is a popular solution!

Step by stepSolved in 4 steps

Knowledge Booster

Similar questions
- Listed below are annual data for various years. The data are weights (metric tons) of imported lemons and car crash fatality rates per 100,000 population. Construct a scatterplot, find the value of the linear correlation coefficient r, and find the P-value using a = 0.05. Is there sufficient evidence to conclude that there is a linear correlation between lemon imports and crash fatality rates? Do the results suggest that imported lemons cause car fatalities? Lemon Imports Crash Fatality Rate 229 266 359 480 530 15.9 15.6 15.5 15.3 14.9 Construct a scatterplot. Choose the correct graph below. OA. В. Ос. D. Ay 17- Ay 17- Ay 17- Ay 17- 16- 16- 16- 16- 15- 15- 15- 15- 14+ 14+ 14- 14+ 200 400 600 200 400 600 200 400 600 200 400 600 The linear correlation coefficient r is (Round to three decimal places as needed.)arrow_forwardListed below are annual data for various years. The data are weights (metric tons) of imported lemons and car crash fatality rates per 100,000 population. Construct a scatterplot, find the value of the linear correlation coefficient r, and find the P-value using a = 0.05. Is there sufficient evidence to conclude that there is a linear correlation between lemon imports and crash fatality rates? Do the results suggest that imported lemons cause car fatalities? Lemon Imports Crash Fatality Rate 231 266 359 480 532 15.9 15.7 15.4 15.2 14.8 Ay 17- Ay 17- Ay 17+ Ay 17- 16- 16- 16- 16- 15- 15- 15- 15- X 14- 14+ 14- 14- 200 400 600 200 400 600 200 400 600 200 400 600 The linear correlation coefficient r is (Round to three decimal places as needed.) The P-value is (Round to three decimal places as needed.) Because the P-value is than the significance level 0.05, there sufficient evidence to support the claim that there is a linear correlation between lemon imports and crash fatality rates for a…arrow_forwardQ9 The explanatory variable in linear correlation/regression model is recorded on which of thesemeasurement scales: A. categorical B. ordinal C. quantitative D. none of the abovearrow_forward
- Listed below are annual data for various years. The data are weights (metric tons) of imported lemons and car crash fatality rates per 100,000 population. Construct a scatterplot, find the value of the linear correlation coefficient r, and find the P-value using a = 0.05. Is there sufficient evidence to conclude that there is a linear correlation between lemon imports and crash fatality rates? Do the results suggest that imported lemons cause car fatalities? Lemon Imports Crash Fatality Rate 228 264 358 482 531 15.9 15.7 15.5 15.3 14.9arrow_forwardListed below are annual data for various years. The data are weights (metric tons) of imported lemons and car crash fatality rates per 100,000 population. Construct a scatterplot, find the value of the linear correlation coefficient r, and find the P-value using a= 0.05. Is there sufficient evidence to conclude that there is a linear correlation between lemon imports and crash fatality rates? Do the results suggest that imported lemons cause car fatalities? Lemon Imports Crash Fatality Rate 266 15.7 228 358 484 531 15.8 15.5 15.2 14.8 What are the null and alternative hypotheses? O B. Ho: p=0 O A. Ho: p#0 H1:p=0 H1:p0 H,: p#0 Construct a scatterplot. Choose the correct graph below. OA. B. Oc. OD. Ay 17- Ay 17- AY 17- Ay 17- 16- Q 16- 16- 16- 15- 15- 15- 15- 14- 14+ 14- 14- 200 400 600 200 400 600 200 400 6ỏ0 200 400 600 The linear correlation coefficient is r= (Round to three decimal places as needed.)arrow_forwardCan you please check my workarrow_forward
- The accompanying data represent the total compensation for 12 randomly selected chief executive officers (CEO) and the company's stock performance in a recent year. Complete parts (a) through (d) below. (a) One would think that a higher stock return would lead to a higher compensation. Based on this, what would likely be the explanatory variable? A.Stock return B.Compensation (c) Determine the linear correlation coefficient between compensation and stock return. r=____? (Round to three decimal places as needed.)arrow_forwardGRC often rely heavily on raising money for an "annual fund" to support operations. Alumni are typically solicited for donations to the annual fund. Studies suggest that the graduate's annual income is a good predictor of the amount of money he or she would be willing to donate, and there is a reasonably strong, positive, linear relationship between these variables. In the studies described: O a. annual income is the predictor variable O b. the correlation between annual income and the size of the donation is negative. O c. the size of the donation to the annual fund is the predictor variable O d. All of the above O e. None of the abovearrow_forwardListed below are annual data for various years. The data are weights (metric tons) of imported lemons and car crash fatality rates per 100,000 population. Construct a scatterplot, find the value of the linear corelation coefficient r, and find the P-value using a=0.05. Is there sufficient evidence to conclude that there is a linear correlation between lemon imports and crash fatality rates? Do the results suggest that imported lemons cause car fatalities? non imports Crash Fatality Rate What are the null and alternative hypotheses? OA. Họ: p=0 H: p>0 OB. He: p=0 H:p<0 OC. He: p=0 H;: p#0 OD. H: pr0 H: p=0 Construct a scatterplot. Choose the correct graph below. OA OB. Oc. OD. 17 17 16 16 15 Click to select your answer(s).arrow_forward
- Assume the professor of a particular course is male, and interpret the coefficient on FemaleStudent. What is the predicted difference in performance between a female student and a male student? What's the magnitude of the coefficient?arrow_forwardListed below are annual data for various years. The data are weights (metric tons) of imported lemons and car crash fatality rates per 100,000 population. Construct a scatterplot, find the value of the linear correlation coefficient r, and find the P-value using a = 0.05. Is there sufficient evidence to conclude that there is a linear correlation between lemon imports and crash fatality rates? Do the results suggest that imported lemons cause car fatalities? Lemon Imports Crash Fatality Rate 231 265 358 483 530 15.8 15.7 15.5 15.2 14.8 What are the null and alternative hypotheses? OA. Ho: p 0 H₁ p=0 OC. Ho p=0 H₁: p>0 Construct a scatterplot. Choose the correct graph below. OA. Ay 17- 16- Q do ° 15- ° 14+ 0 200 400 600 The linear correlation coefficient is r= (Round to three decimal places as needed.) B. Ho: p=0 H₁p 0 OD. Ho: p=0 H₁: p<0 B. COD. Ay 17- Ay 17- Ay 17+ Q о 16- 16- 16- Q 0 ° ° 15- 15- ° G 15- G 14- 14- 14+ 0 200 400 600 0 200 400 600 0 200 400 600arrow_forwardAfter gathering data about the number of starfish and measuring the pollution in areas of the ocean you find a negative linear correlation between pollution levels and number of starfish. What can you conclude based on this information? a. There is a confounding variable that is affecting both pollution and starfish. b. As pollution rises the number of starfish falls c. That pollution is causing starfish to die, leading to the negative correlation d. That pollution is supporting starfish, leading to the negative correlationarrow_forward
arrow_back_ios
arrow_forward_ios
Recommended textbooks for you
- MATLAB: An Introduction with ApplicationsStatisticsISBN:9781119256830Author:Amos GilatPublisher:John Wiley & Sons Inc
 Probability and Statistics for Engineering and th...StatisticsISBN:9781305251809Author:Jay L. DevorePublisher:Cengage Learning
 Statistics for The Behavioral Sciences (MindTap C...StatisticsISBN:9781305504912Author:Frederick J Gravetter, Larry B. WallnauPublisher:Cengage Learning
  Elementary Statistics: Picturing the World (7th E...StatisticsISBN:9780134683416Author:Ron Larson, Betsy FarberPublisher:PEARSON
 The Basic Practice of StatisticsStatisticsISBN:9781319042578Author:David S. Moore, William I. Notz, Michael A. FlignerPublisher:W. H. Freeman
 Introduction to the Practice of StatisticsStatisticsISBN:9781319013387Author:David S. Moore, George P. McCabe, Bruce A. CraigPublisher:W. H. Freeman
MATLAB: An Introduction with Applications
Statistics
ISBN:9781119256830
Author:Amos Gilat
Publisher:John Wiley & Sons Inc
Probability and Statistics for Engineering and th...
Statistics
ISBN:9781305251809
Author:Jay L. Devore
Publisher:Cengage Learning
Statistics for The Behavioral Sciences (MindTap C...
Statistics
ISBN:9781305504912
Author:Frederick J Gravetter, Larry B. Wallnau
Publisher:Cengage Learning
Elementary Statistics: Picturing the World (7th E...
Statistics
ISBN:9780134683416
Author:Ron Larson, Betsy Farber
Publisher:PEARSON
The Basic Practice of Statistics
Statistics
ISBN:9781319042578
Author:David S. Moore, William I. Notz, Michael A. Fligner
Publisher:W. H. Freeman
Introduction to the Practice of Statistics
Statistics
ISBN:9781319013387
Author:David S. Moore, George P. McCabe, Bruce A. Craig
Publisher:W. H. Freeman