
MATLAB: An Introduction with Applications
6th Edition
ISBN: 9781119256830
Author: Amos Gilat
Publisher: John Wiley & Sons Inc
expand_more
expand_more
format_list_bulleted
Related questions
Question
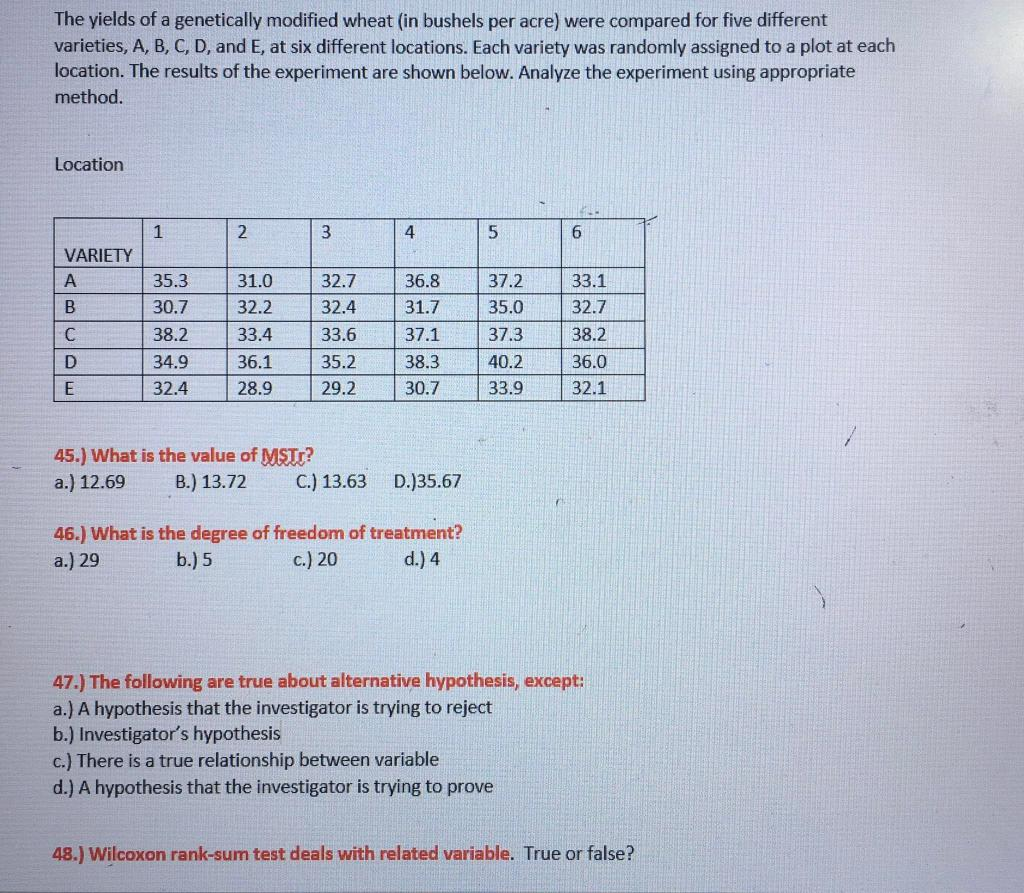

Transcribed Image Text:The yields of a genetically modified wheat (in bushels per acre) were compared for five different
varieties, A, B, C, D, and E, at six different locations. Each variety was randomly assigned to a plot at each
location. The results of the experiment are shown below. Analyze the experiment using appropriate
method.
Location
1
2
VARIETY
35.3
31.0
32.7
36.8
37.2
33.1
30.7
32.2
32.4
31.7
35.0
32.7
C
38.2
33.4
33.6
37.1
37.3
38.2
D
34.9
36.1
35.2
38.3
40.2
36.0
32.4
28.9
29.2
30.7
33.9
32.1
45.) What is the value of MSTr?
B.) 13.72
a.) 12.69
C.) 13.63
D.)35.67
46.) What is the degree of freedom of treatment?
a.) 29
b.) 5
c.) 20
d.) 4
47.) The following are true about alternative hypothesis, except:
a.) A hypothesis that the investigator is trying to reject
b.) Investigator's hypothesis
c.) There is a true relationship between variable
d.) A hypothesis that the investigator is trying to prove
48.) Wilcoxon rank-sum test deals with related variable. True or false?
Expert Solution
This question has been solved!
Explore an expertly crafted, step-by-step solution for a thorough understanding of key concepts.

Step by stepSolved in 2 steps with 1 images

Knowledge Booster

Similar questions
- Rothamsted Experimental Station (England) has studied wheat production since 1852. Each year, many small plots of equal size but different soil/fertilizer conditions are planted with wheat. At the end of the growing season, the yield (in pounds) of the wheat on the plot is measured. For a random sample of years, one plot gave the following annual wheat production (in pounds). 4.02 4.17 3.87 3.99 3.72 3.79 4.09 4.42 3.89 3.87 4.12 3.09 4.86 2.90 5.01 3.39 Use a calculator to verify that, for this plot, the sample variance is s2 ≈ 0.302.Another random sample of years for a second plot gave the following annual wheat production (in pounds). 3.49 3.61 3.49 4.06 4.03 3.72 4.13 4.01 3.59 4.29 3.78 3.19 3.84 3.91 3.66 4.35 Use a calculator to verify that the sample variance for this plot is s2 ≈ 0.100.Test the claim that the population variance of annual wheat production for the first plot is larger than that for the second plot. Use a 1% level of significance. State the…arrow_forwardConsider the following situation. A completely randomized design was used to assess the effects of a treatment (say A) on the yield (say Y) of a particular process. Treatment A had three levels (say A1, A2, and A3) and the design was unbalanced in that the sample sizes for each treatment level were n₁ = 4, n2 = 5, n3 =6 respectively. The data was analyzed using R and produced the following statistics: SSbetween 2032.20, M Swithin = 74.76, Y₁ = 94.5, Y₂ = 105.2, Y3 = 122.7. Fill in the blanks for the incomplete ANOVA table. What is the corresponding F-statistic and p-value for testing the alternative hypothesis that the means of the three treatments are not all equal? Mean square (MS) F-statistic p-value a.. Between Within Total Sum-of-squares (SS) Degrees of freedom 2032.20 74.76arrow_forwardK Contrast bath treatments use the immersion of an injured limb alternately in water of two contrasting temperatures. Those who use the method claim that it can reduce swelling. Researchers compared three treatments: (1) contrast baths and exercise, (2) contrast baths alone, and (3) exercise alone. They report the boxplots to the right, (... Change in Volume (cc) 40- 20- 0- -20- -40- O HH • HTH TH Treatment 3 a) The researchers conclude that the differences were not statistically significant. Explain what that means in context. Q o OA. There is no evidence that the changes in swelling were different among the three treatments. The experiment should be run again with more subjects. OB. There is evidence that the changes in swelling were different among the three treatments, but not enough data to tell which treatment was most effective. All three treatments appear to cause an unknown but unequal reduction in swelling. OC. There is no evidence that the changes in swelling were different…arrow_forward
- Bighorn sheep are found in the mountainous western United States. In the following data, x = the age of bighorn sheep in years and y = the percentage of that age group that die during the course of a year (mortality rate). In the table below, when x = 5, y = 20 meaning that 20% of the sheep aged between 5 and 6 years old die. A random sample of sheep provided the following information: x 1 2 3 4 5 y 14 18.9 14.4 19.6 20 ∑ x = 15 ; ∑ y = 86.9 ; ∑ x 2 = 55 ; ∑ y 2 = 1544.73 ; ∑ x y = 273.4 find m for this dataarrow_forward3. Can SAT scores predict college performance? Let x be a variable that represents SAT score of a computer science major, and let y be a variable that represents a student’s GPA upon graduation. A random sample of n =15 computer science majors provided their SAT scores and GPAs: x 1232 1070 1086 1287 1130 1048 1121 1095 1135 1208 1333 1160 1186 1243 1261 y 3.52 2.91 2.4 3.47 3.47 2.37 2.4 2.24 3.02 3.32 3.59 2.54 3.19 3.71 3.58 The scatter diagram for the SAT score and GPA is given below: (a) Find the sample correlation coefficient r. Truncate to two decimal places. What does the value tell you about the data? (b) Find the equation of the least squares line . Truncate to four decimal places. What does the slope mean? (c) Find the value of the coefficient of determination . Truncate to two decimal places. What does this number mean? (d) What is the predicted GPA if a computer science major got a…arrow_forwardSPSS: In order to compare a new variety of wheat with a standard, an experiment is used with six plots receiving the new variety and ten plots receiving the standard. The yields (t/ha) are as follows: New variety: 2.6 2.1 2.5 2.4 1.9 2.3 Standard variety: 1.7 2.1 2.0 1.8 2.3 1.6 2.0 2.1 2.2 1.9 a) Identify the model for comparing the wheat yield. b) Is there evidence at the 5% significance level that the yield of the new variety is higher? c) Estimate the difference in yield with 95% confidence.arrow_forward
- refer to image belowarrow_forwardAssume the population is normally distributedarrow_forward2. This is a sample of 10 random seasons in the National Hockey League, Wayne Gretzky scored 50% more points than anyone who ever played professional hockey. He accomplished this amazing feat while playing in 280 fewer games than Gordie Howe, the previous record holder. Here are the number of games Gretzky played during each season. 45 70 73 73 74 78 79 80 80 82 e. What is the shape of the data?f. What is the best measure of center and spread to use for this data setarrow_forward
- Hans plays a game when he exercises. He chooses a marble from a bag of three marbles: one is blue, one is red, and one is green. Based on the marble he chooses, he completes a certain number of push-ups, as shown below. Marble Number of push-ups blue red green 10 Consider choosing a marble like sampling from a population. (The population mean of the number of push-ups is u=9.00 and the population standard deyiation is o =0.82.) (a) Suppose a sample of size 2 is randomly selected from the population, with replacement, as follows. One marble is randomly chosen, the number of push- ups is completed, and the marble is put back into the bag. Then for a second time a marble is randomly chosen and the number of push-ups is completed. There are 9 possible samples. The numbers of push-ups for several of the possible samples have been listed in the table below. Enter the numbers of push-ups for the remaining possible samples. When you are done, select "Compute". In the "Sample mean, x" column,…arrow_forwardWhich of the following can increase effect size? Select one: O a. increase the distance between means and increase the sample size O b. decrease the variability and increase the distance between means O c. decrease the variability and increase the sample sizearrow_forwardA researcher studying air quality in a metropolitan city is interested in testing the claim that less than 20% of people smoke cigarettes to test this claim the researcher collects the following data on a sample of 700 adults and 110 of them smoke cigarettes the following is the data from the study. Sample size= 700 adults Alternative hypothesis= ha:parrow_forward
arrow_back_ios
SEE MORE QUESTIONS
arrow_forward_ios
Recommended textbooks for you
- MATLAB: An Introduction with ApplicationsStatisticsISBN:9781119256830Author:Amos GilatPublisher:John Wiley & Sons Inc
 Probability and Statistics for Engineering and th...StatisticsISBN:9781305251809Author:Jay L. DevorePublisher:Cengage Learning
 Statistics for The Behavioral Sciences (MindTap C...StatisticsISBN:9781305504912Author:Frederick J Gravetter, Larry B. WallnauPublisher:Cengage Learning
  Elementary Statistics: Picturing the World (7th E...StatisticsISBN:9780134683416Author:Ron Larson, Betsy FarberPublisher:PEARSON
 The Basic Practice of StatisticsStatisticsISBN:9781319042578Author:David S. Moore, William I. Notz, Michael A. FlignerPublisher:W. H. Freeman
 Introduction to the Practice of StatisticsStatisticsISBN:9781319013387Author:David S. Moore, George P. McCabe, Bruce A. CraigPublisher:W. H. Freeman
MATLAB: An Introduction with Applications
Statistics
ISBN:9781119256830
Author:Amos Gilat
Publisher:John Wiley & Sons Inc
Probability and Statistics for Engineering and th...
Statistics
ISBN:9781305251809
Author:Jay L. Devore
Publisher:Cengage Learning
Statistics for The Behavioral Sciences (MindTap C...
Statistics
ISBN:9781305504912
Author:Frederick J Gravetter, Larry B. Wallnau
Publisher:Cengage Learning
Elementary Statistics: Picturing the World (7th E...
Statistics
ISBN:9780134683416
Author:Ron Larson, Betsy Farber
Publisher:PEARSON
The Basic Practice of Statistics
Statistics
ISBN:9781319042578
Author:David S. Moore, William I. Notz, Michael A. Fligner
Publisher:W. H. Freeman
Introduction to the Practice of Statistics
Statistics
ISBN:9781319013387
Author:David S. Moore, George P. McCabe, Bruce A. Craig
Publisher:W. H. Freeman