
MATLAB: An Introduction with Applications
6th Edition
ISBN: 9781119256830
Author: Amos Gilat
Publisher: John Wiley & Sons Inc
expand_more
expand_more
format_list_bulleted
Related questions
Question
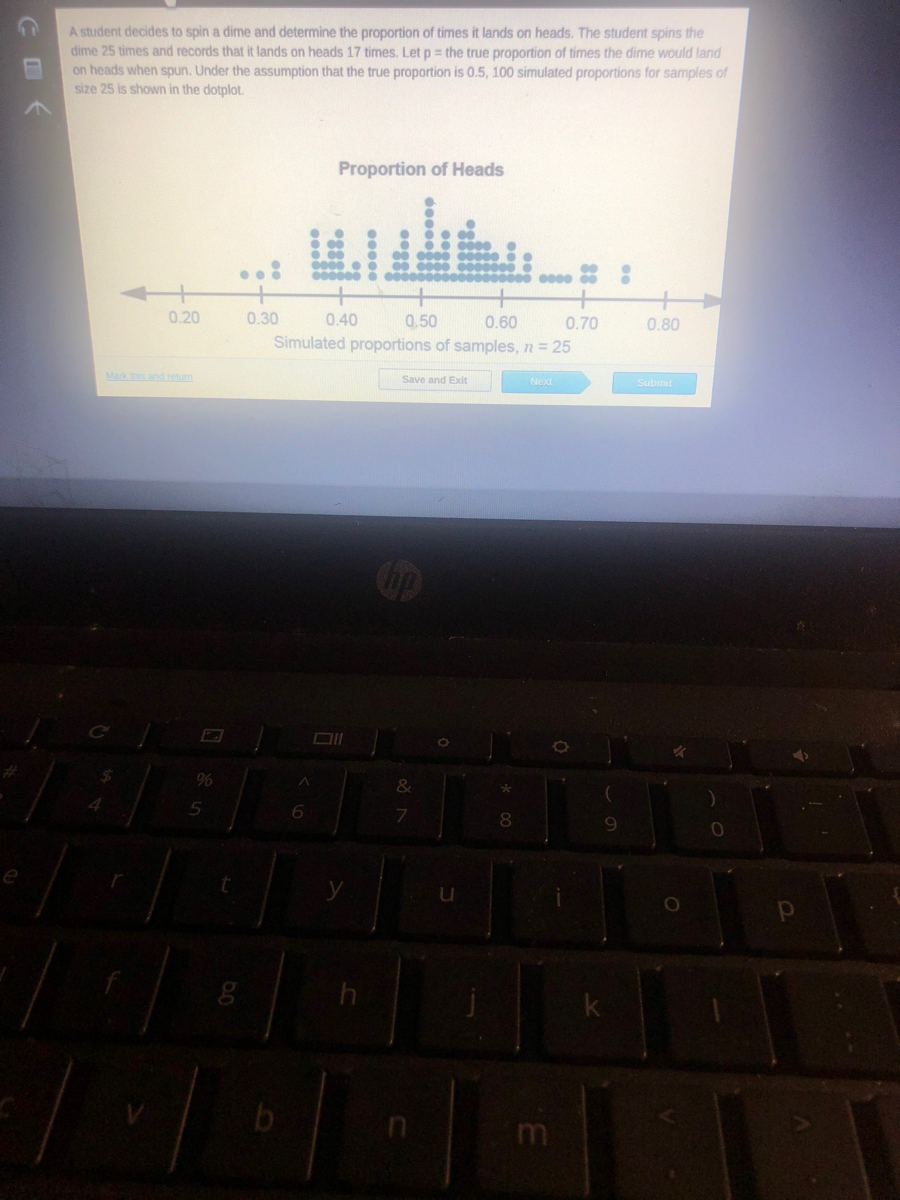

Transcribed Image Text:A student decides to spin a dime and determine the proportion of times it lands on heads. The student spins the
dime 25 times and records that it lands on heads 17 times. Let p = the true proportion of times the dime would land
on heads when spun. Under the assumption that the true proportion is 0.5, 100 simulated proportions for samples of
size 25 is shown in the dotplot.
Proportion of Heads
0.20
0.30
0.40
0.50
Simulated proportions of samples, n = 25
0.60
0.70
0.80
Mark this and retun
Save and Exit
Next
Submit
up
9%
&
*-
8.
e
m

Transcribed Image Text:0.20
0.30
0.40
0.50
0.60
0.70
0.80
Simulated proportions of samples, n 25
Using the dotplot, is there evidence that the proportion of times a.spun dime lands on heads is greater than 0,5?
O Yes, a proportion of 0.68 proves that the true proportion of heads is greater than 0.5.
O Yes, a proportion of 0.68 only occurred once out of 100 simulated proportions; therefore, there is sufficient
evidence that the true proportion of heads is greater than 0.5.
O No, a proportion of 0.68 is only 0.18 more than 0.5; therefore, there is insufficient evidence that the true proportion
of heads is greater than 0.5.
O No, a proportion of 0.68 or more occurred 7 times out of 100 simulated proportions; therefore, there is insufficient
evidence that the true proportion of heads is greater than 0.5.
Mark this and retum
Save and Exit
Next
Submit
96
&
4.
8.
mi
Expert Solution
This question has been solved!
Explore an expertly crafted, step-by-step solution for a thorough understanding of key concepts.

This is a popular solution

Trending nowThis is a popular solution!

Step by stepSolved in 2 steps

Knowledge Booster


Learn more about
Need a deep-dive on the concept behind this application? Look no further. Learn more about this topic, statistics and related others by exploring similar questions and additional content below.Similar questions
- What is the inter-quartile range of pH values. (choose the closest answer)? ph 5.8 5.7 5.6 5.5 5.4 5.3 5.2 5.1 5.0 4.7 4.6 4.5 4.4 4.3 4.2 4.1 A. 0.5 B. 4.9 C. 0.6 D. 4.3 E. 1.6 Boxplot of ph Iarrow_forwardYou want to obtain a sample to estimate a population proportion. Based on previous evidence, you believe the population proportion is approximately p = 0.34. You would like to be 90% confident that your esimate is within 1.5% of the true population proportion. How large of a sample size is requiredarrow_forwardWith 99% confidence, maximum error is 0.06 and the proportion p = 0.5. Find the sample size. a. 463 b. 436 c. 364 d. 643 e. NONE OF THE ABOVE Aarrow_forward
- 2 proportion z-test 3. In a study done in Michigan, it was determined 38 (out of 62) poor children who attended pre-school needed social services later in life compared to 49 (out of 61) poor children who did not attend preschool. Does this study provide significant evidence that preschool reduces the need for social services later in life?arrow_forwardFor a sample size of 115 and a population parameter of 0.1, what is the standard error of the sampling distribution? Round your answer to three decimal places. A. 0.054 ) B. 0.043 OC. 0.028 D. 0.035arrow_forwardndependent random samples of professional football and basketball players gave the following information. Heights (in ft) of pro football players: x1; n1 = 45 6.31 6.51 6.50 6.25 6.50 6.33 6.25 6.17 6.42 6.33 6.42 6.58 6.08 6.58 6.50 6.42 6.25 6.67 5.91 6.00 5.83 6.00 5.83 5.08 6.75 5.83 6.17 5.75 6.00 5.75 6.50 5.83 5.91 5.67 6.00 6.08 6.17 6.58 6.50 6.25 6.33 5.25 6.65 6.50 5.85 Heights (in ft) of pro basketball players: x2; n2 = 40 6.09 6.56 6.25 6.58 6.25 5.92 7.00 6.41 6.75 6.25 6.00 6.92 6.84 6.58 6.41 6.67 6.67 5.75 6.25 6.25 6.50 6.00 6.92 6.25 6.42 6.58 6.58 6.08 6.75 6.50 6.83 6.08 6.92 6.00 6.33 6.50 6.58 6.85 6.50 6.58 (a) Use a calculator with mean and standard deviation keys to calculate x1, s1, x2, and s2. (Round your answers to four decimal places.) x1 = s1 = x2 = s2 = (b) Let μ1 be the population mean for x1 and let μ2 be the population mean for x2. Find a 90% confidence interval for μ1 – μ2. (Round your answers to…arrow_forward
- Using the given margin of error, confidence level, and likely range for the observed value of the sample proportion, obtain a sample size that will ensure a margin of error of at most the one specified (provided, of course, that the observed value of the sample proportion is further from 0.5 than the educated guess). margin of error = 0.01; confidence level = 95%; likely range = 0.3 to 0.4 The required sample size is n = (Round up to the nearest whole number.)arrow_forwardA Find the standard error of the mean for each sampling situation (assuming a normal population). (Round your answers to two decimal places). 1. O=56, n=4 2. O=56, n=16 3. O=56, n=64 B. What happens to the standard error each time you quadruple the sample size? The standard error is ________ by half.arrow_forwardanswer mmultiple choicearrow_forward
arrow_back_ios
arrow_forward_ios
Recommended textbooks for you
- MATLAB: An Introduction with ApplicationsStatisticsISBN:9781119256830Author:Amos GilatPublisher:John Wiley & Sons Inc
 Probability and Statistics for Engineering and th...StatisticsISBN:9781305251809Author:Jay L. DevorePublisher:Cengage Learning
 Statistics for The Behavioral Sciences (MindTap C...StatisticsISBN:9781305504912Author:Frederick J Gravetter, Larry B. WallnauPublisher:Cengage Learning
  Elementary Statistics: Picturing the World (7th E...StatisticsISBN:9780134683416Author:Ron Larson, Betsy FarberPublisher:PEARSON
 The Basic Practice of StatisticsStatisticsISBN:9781319042578Author:David S. Moore, William I. Notz, Michael A. FlignerPublisher:W. H. Freeman
 Introduction to the Practice of StatisticsStatisticsISBN:9781319013387Author:David S. Moore, George P. McCabe, Bruce A. CraigPublisher:W. H. Freeman
MATLAB: An Introduction with Applications
Statistics
ISBN:9781119256830
Author:Amos Gilat
Publisher:John Wiley & Sons Inc
Probability and Statistics for Engineering and th...
Statistics
ISBN:9781305251809
Author:Jay L. Devore
Publisher:Cengage Learning
Statistics for The Behavioral Sciences (MindTap C...
Statistics
ISBN:9781305504912
Author:Frederick J Gravetter, Larry B. Wallnau
Publisher:Cengage Learning
Elementary Statistics: Picturing the World (7th E...
Statistics
ISBN:9780134683416
Author:Ron Larson, Betsy Farber
Publisher:PEARSON
The Basic Practice of Statistics
Statistics
ISBN:9781319042578
Author:David S. Moore, William I. Notz, Michael A. Fligner
Publisher:W. H. Freeman
Introduction to the Practice of Statistics
Statistics
ISBN:9781319013387
Author:David S. Moore, George P. McCabe, Bruce A. Craig
Publisher:W. H. Freeman