
MATLAB: An Introduction with Applications
6th Edition
ISBN: 9781119256830
Author: Amos Gilat
Publisher: John Wiley & Sons Inc
expand_more
expand_more
format_list_bulleted
Related questions
Question
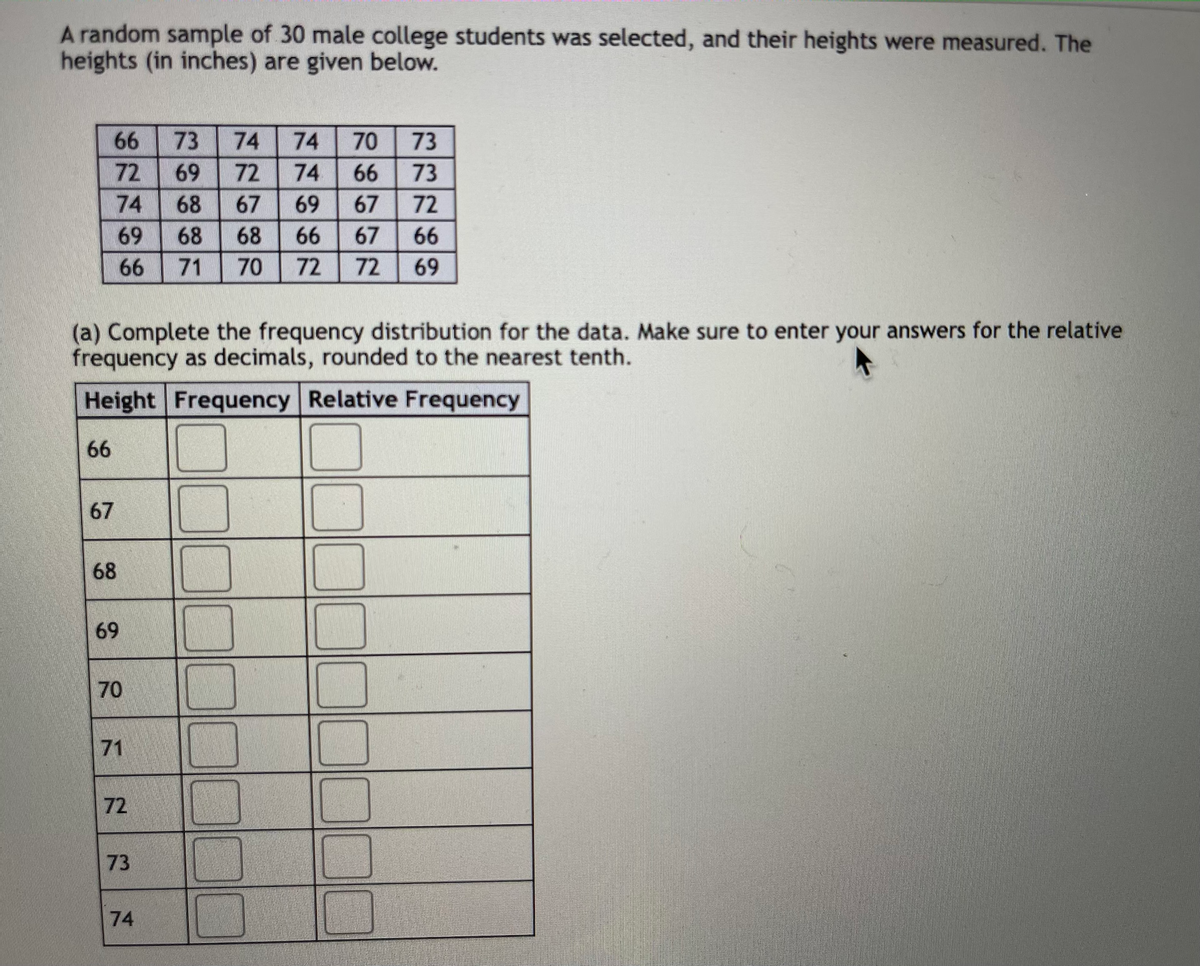

Transcribed Image Text:A random sample of 30 male college students was selected, and their heights were measured. The
heights (in inches) are given below.
66
73
74
74
70
73
72
69
72
74
66
73
74
68
67
69
67
72
69
68
68
66
67
66
66
71
70
72
72
69
(a) Complete the frequency distribution for the data. Make sure to enter your answers for the relative
frequency as decimals, rounded to the nearest tenth.
Height Frequency Relative Frequency
66
67
68
69
70
71
72
73
74
D00000

Transcribed Image Text:(b) Which of the following is the correct histogram for this data?
8.
65
67
69
71
Height
73
75
4
2
65 66 67 68 69 70 71 72 73 74 75
Height
7
6.
4
3
65
67
69
71
73
75
Height
1
65 66 67 68 69 70 71 72 73 74 75
Height
Frequency
Frequency
Frequency
Frequency
21
Expert Solution
This question has been solved!
Explore an expertly crafted, step-by-step solution for a thorough understanding of key concepts.

This is a popular solution

Trending nowThis is a popular solution!

Step by stepSolved in 3 steps with 1 images

Knowledge Booster

Similar questions
- The following data show the ages of recent award-winning male actors at the time when they won their award. Make a frequency table for the data, using bins of 20-29, 30-39, and so on. Click the icon to view the ages of male actors. Complete the table below. Age 20-29 30-39 40-49 50-59 60-69 70-79 No. of actors ☐☐☐☐☐☐ Data table 20 54 34 41 50 59 48 34 31 65 44 28 79 49 48 34 59 59 34 44 48 31 43 35 63 58 35 49 41 77 43 C 57 30 38 D - Xarrow_forwardThe following data show the ages of recent award-winning male actors at the time when they won their award. Make a frequency table for the data, using bins of 20-29, 30-39, and so on. Click the icon to view the ages of male actors. Complete the table below. Age No. of actors Data Table 20-29 30-39 40-49 36 53 23 67 53 56 48 39 49 52 50-59 37 49 50 46 31 42 65 57 73 33 60-69 53 41 31 49 41 35 39 46 48 34 70-79 35 63 42 37 Print Donearrow_forwardAt the college bookstore, the following sales were rung up. Based on this, prepare a frequency distribution. Use intervals of 0 — $5.99, $6.00 — $11.99, $12.00 — $17.99, and $18.00 — $23.99. $ 6.95 $ 7.50 $ 6.91 $ 18.60 $ 8.25 $ 21.55 $ 10.50 $ 13.10 $ 22.95 $ 11.11 $ 12.00 $ 10.18 $ 3.50 $ 14.88 $ 9.31 $ 16.95 Intervals: Tally: Frequency: $0-5.99 1 1 $6-11.99 ? (not 8) 8 $12-17.99 ? (not 4) 4 $18-23.99 ? (not 3) 3 Please answer for the ? Tally spaces.arrow_forward
- Round your answers to three decimal places, if necessary. The results of a survey of 150 students about the type of movie they prefer are shown in the two-way frequency table. Preferred Movie Type Gender Comedy Drama Science Fiction Total Girl 22 33 15 70 Boy 28 12 40 80 Total 50 45 55 150 Complete the two-way relative frequency table for the data using decimals.arrow_forwardThe frequency table below gives the frequency of exam scores rounded to the nearest 5%. Find the mean and round to one decimal place as needed. Number Percentages of on an Exam 65 70 75 80 85 90 95 100 Students 4 8 7 11 9 7 2 2arrow_forwardFind the mean of the data summarized in the given frequency distribution. Compare the computed mean to the actual mean of 57.4 degrees. The mean of the frequency distribution is (Round to the nearest tenth as needed.)arrow_forward
- Use the frequency histogram to estimate the least and greatest frequency. Figure 1. Salary (in thousands of Dollars) 323742475257620100200300Frequency Histogram A. least: 50, greatest: 200 B. least 110, greatest: 300 C. least: 20, greatest: 270 D. least 32, greatest: 62arrow_forwardThe following data set outlines the scores students had on an Algebra test. 41 42 43 43 43 43 43 44 44 44 44 45 45 45 45 i) Fill in the frequency table (below) Scores 7 6 5 4 3 2 40 43 44 45 1 39 ii) Draw a dot plot on the graph below. You do not need to show the entire column of dots, only the one on the top representing the frequency of the test score. Score 40 40 41 42 43 44 45 19 41 42 13 43 Frequency 44 45 40arrow_forwardThe dot plot shows the grades received on a recent test. : 十 70 75 80 85 90 95 100 Question 1: What is the range of the data? Question 2: What is the median of the data? the mode of the data? Question 3: What is Question 4: What is the mean of the data?arrow_forward
- A random sample of 30 male college students was selected, and their heights were measured. The heights (in inches) are given below. 69 72 73 72 66 69 70 74 72 66 67 72 73 68 72 72 68 68 70 69 71 66 74 74 69 66 66 74 70 69 (a) Complete the frequency distribution for the data. Make sure to enter your answers for the relative frequency as decimals, rounded to the nearest tenth. Height Frequency Relative Frequency 66 67 68 69 70 71 72 73 74 NISarrow_forwardAnswer all questionsarrow_forwardA. Population ? B. Population mean ? C. Median ? F. IQR ? G. Population standard deviation ?H. population variance ?arrow_forward
arrow_back_ios
SEE MORE QUESTIONS
arrow_forward_ios
Recommended textbooks for you
- MATLAB: An Introduction with ApplicationsStatisticsISBN:9781119256830Author:Amos GilatPublisher:John Wiley & Sons Inc
 Probability and Statistics for Engineering and th...StatisticsISBN:9781305251809Author:Jay L. DevorePublisher:Cengage Learning
 Statistics for The Behavioral Sciences (MindTap C...StatisticsISBN:9781305504912Author:Frederick J Gravetter, Larry B. WallnauPublisher:Cengage Learning
  Elementary Statistics: Picturing the World (7th E...StatisticsISBN:9780134683416Author:Ron Larson, Betsy FarberPublisher:PEARSON
 The Basic Practice of StatisticsStatisticsISBN:9781319042578Author:David S. Moore, William I. Notz, Michael A. FlignerPublisher:W. H. Freeman
 Introduction to the Practice of StatisticsStatisticsISBN:9781319013387Author:David S. Moore, George P. McCabe, Bruce A. CraigPublisher:W. H. Freeman
MATLAB: An Introduction with Applications
Statistics
ISBN:9781119256830
Author:Amos Gilat
Publisher:John Wiley & Sons Inc
Probability and Statistics for Engineering and th...
Statistics
ISBN:9781305251809
Author:Jay L. Devore
Publisher:Cengage Learning
Statistics for The Behavioral Sciences (MindTap C...
Statistics
ISBN:9781305504912
Author:Frederick J Gravetter, Larry B. Wallnau
Publisher:Cengage Learning
Elementary Statistics: Picturing the World (7th E...
Statistics
ISBN:9780134683416
Author:Ron Larson, Betsy Farber
Publisher:PEARSON
The Basic Practice of Statistics
Statistics
ISBN:9781319042578
Author:David S. Moore, William I. Notz, Michael A. Fligner
Publisher:W. H. Freeman
Introduction to the Practice of Statistics
Statistics
ISBN:9781319013387
Author:David S. Moore, George P. McCabe, Bruce A. Craig
Publisher:W. H. Freeman