
MATLAB: An Introduction with Applications
6th Edition
ISBN: 9781119256830
Author: Amos Gilat
Publisher: John Wiley & Sons Inc
expand_more
expand_more
format_list_bulleted
Related questions
Topic Video
Question
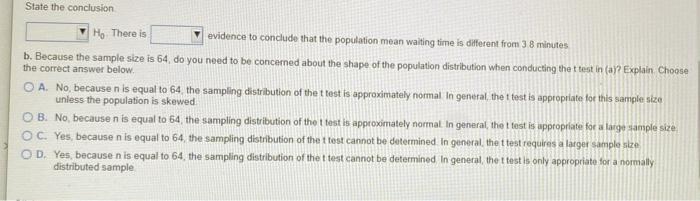

Transcribed Image Text:State the conclusion
Ho There is
evidence to conclude that the population mean waiting time is different from 38 minutes
b. Because the sample size is 64, do you need to be concerned about the shape of the population distribution when conducting the t test in (a)? Explain Choose
the correct answer below.
O A. No, because n is equal to 64, the sampling distribution of the t test is approximately normal In general, the t test is appropriate for this sample size
unless the population is skewed
O B. No, because n is equal to 64, the sampling distribution of the t test is approximately normal In general, the t test is appropriate for a large sample size
OC. Yes, because n is equal to 64, the sampling distribution of the t test cannot be determined. In general, the t test requires a larger sample size
O D. Yes, because n is equal to 64, the sampling distribution of the t test cannot be determined In general, the t test is only appropriate for a normally
distributed sample
Expert Solution
This question has been solved!
Explore an expertly crafted, step-by-step solution for a thorough understanding of key concepts.

Step by stepSolved in 2 steps with 1 images

Knowledge Booster


Learn more about
Need a deep-dive on the concept behind this application? Look no further. Learn more about this topic, statistics and related others by exploring similar questions and additional content below.Similar questions
- I'm stuck, i can not get past the second part.arrow_forwardLet's look at attendance between the two leagues and draw some conclusions. For purposes parts D and E, we are assuming that separating the data into 2 groups based on League is considered sampling; thus, we have 2 samples (American League and National League) and assume we do NOT know the population standard deviations for both "populations" (we only have 1 overall population, not 2). What was the average attendance in each league? Round your answer to 3 decimal places. American League average attendance mil National League average attendance mil space space Perform a hypothesis test to determine whether there is a difference in the mean attendance of teams in the American League vs teams in the National League. Use a 0.05 level of significance in your testing procedures. Additionally: You will need to know the standard deviations and variances for attendance in each league to conduct this test. We are assuming that both American and National League attendance…arrow_forwardPlease answer parts A & B, the data table is in the picture below. Thank you! :)arrow_forward
- Pls help I need in 1 hourarrow_forwardUse technology to help you test the claim about the population mean, H, at the given level of significance, a, using the given sample statistics. Assume the pop normally distributed. Claim: u> 1190; a= 0.07; o 201.21. Sample statistics: x = 1210.03, n 300 Identify the null and alternative hypotheses. Choose the correct answer below. O A. Ho > 1210.03 O B. Ho u21190 Ha Hs 1210.03 Ha µ 1190 Ha us1190 D. Ho us1190 Ha H> 1190 O E. Ho H21210.03 O F. Ho µs1210.03 Ha µ 1210.03 Calculate the standardized test statistic. The standardized test statistic is 1.72 . (Round to two decimal places as needed.) Determine the P-value. (Round to three decimal places as needed.) (1,1) More Enter your answer in the answer box and then click Check Answer. Final Check Clear All 1 part remaining 0 耳@ earcharrow_forward7arrow_forward
- I didnt mean to select an option on the second portion but I need help solving this.arrow_forwardOnly parts c and darrow_forwardUse technology to help you test the claim about the population mean, µ, at the given level of significance, a, using the given sample statistics. Assume the population is normally distributed. Claim: µs 1210; a = 0.07; o=201.42. Sample statistics: x = 1231.33, n= 300 Identify the null and alternative hypotheses. Choose the correct answer below. O A. Ho: µs 1210 H3: µ> 1210 O B. Ho: µs 1231.33 Ha p> 1231.33 O D. H μ2 1210 O C. Ho: µ> 1231.33 Ha: us 1231.33 H3: µ 1210 Click to select your answer and then click Check Answer.arrow_forward
- 2arrow_forwardPlease Answer thisarrow_forwardWhen the distance from the smallest observation to the 1st quartile is much greater than the distance from the 3rd quartile to the largest observation, the data set is most likely Two answers correct. 1. symmetrical. 2. nonsymmetrical. 3. skewed to the right. 4. skewed to the left. 5. not skewed.arrow_forward
arrow_back_ios
SEE MORE QUESTIONS
arrow_forward_ios
Recommended textbooks for you
- MATLAB: An Introduction with ApplicationsStatisticsISBN:9781119256830Author:Amos GilatPublisher:John Wiley & Sons Inc
 Probability and Statistics for Engineering and th...StatisticsISBN:9781305251809Author:Jay L. DevorePublisher:Cengage Learning
 Statistics for The Behavioral Sciences (MindTap C...StatisticsISBN:9781305504912Author:Frederick J Gravetter, Larry B. WallnauPublisher:Cengage Learning
  Elementary Statistics: Picturing the World (7th E...StatisticsISBN:9780134683416Author:Ron Larson, Betsy FarberPublisher:PEARSON
 The Basic Practice of StatisticsStatisticsISBN:9781319042578Author:David S. Moore, William I. Notz, Michael A. FlignerPublisher:W. H. Freeman
 Introduction to the Practice of StatisticsStatisticsISBN:9781319013387Author:David S. Moore, George P. McCabe, Bruce A. CraigPublisher:W. H. Freeman
MATLAB: An Introduction with Applications
Statistics
ISBN:9781119256830
Author:Amos Gilat
Publisher:John Wiley & Sons Inc
Probability and Statistics for Engineering and th...
Statistics
ISBN:9781305251809
Author:Jay L. Devore
Publisher:Cengage Learning
Statistics for The Behavioral Sciences (MindTap C...
Statistics
ISBN:9781305504912
Author:Frederick J Gravetter, Larry B. Wallnau
Publisher:Cengage Learning
Elementary Statistics: Picturing the World (7th E...
Statistics
ISBN:9780134683416
Author:Ron Larson, Betsy Farber
Publisher:PEARSON
The Basic Practice of Statistics
Statistics
ISBN:9781319042578
Author:David S. Moore, William I. Notz, Michael A. Fligner
Publisher:W. H. Freeman
Introduction to the Practice of Statistics
Statistics
ISBN:9781319013387
Author:David S. Moore, George P. McCabe, Bruce A. Craig
Publisher:W. H. Freeman