
Related questions
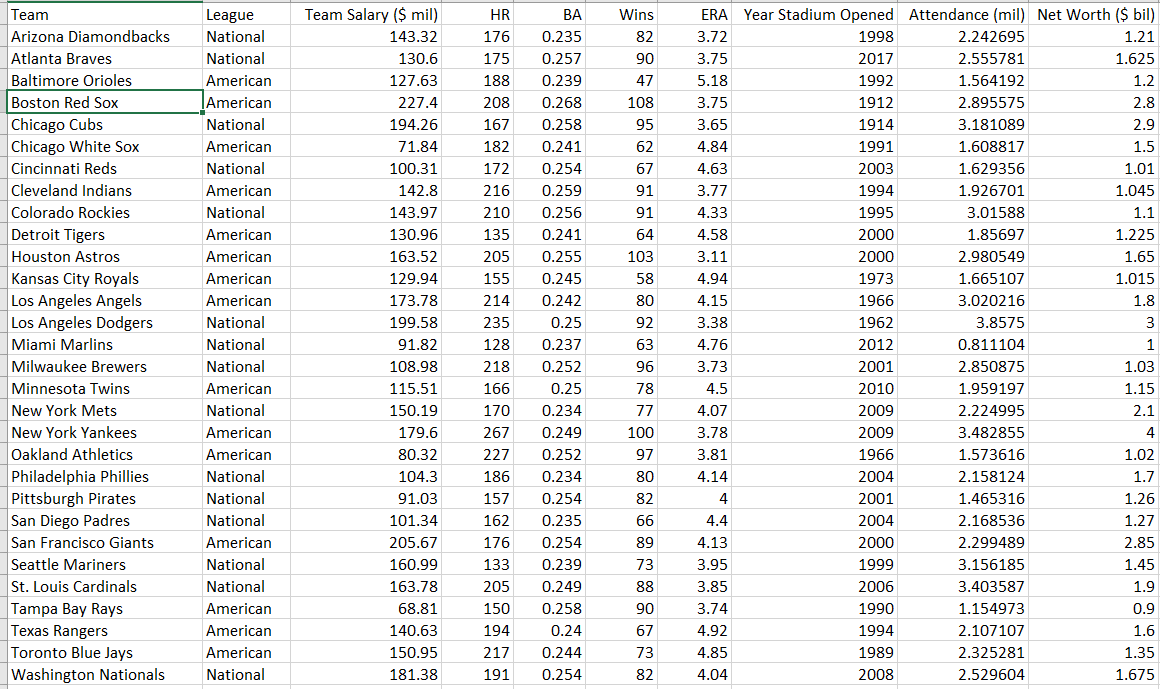
Let's look at attendance between the two leagues and draw some conclusions. For purposes parts D and E, we are assuming that separating the data into 2 groups based on League is considered sampling; thus, we have 2 samples (American League and National League) and assume we do NOT know the population standard deviations for both "populations" (we only have 1 overall population, not 2).
- What was the average attendance in each league? Round your answer to 3 decimal places.
|
American League average attendance |
mil |
|
National League average attendance |
mil |
space
space
- Perform a hypothesis test to determine whether there is a difference in the
mean attendance of teams in the American League vs teams in the National League. Use a 0.05 level of significance in your testing procedures. Additionally:
- You will need to know the standard deviations and variances for attendance in each league to conduct this test.
- We are assuming that both American and National League attendance figures follow a
normal distribution . - American and National league data are samples; thus, the population standard deviations are unknown.
SPACE
Hint: When calculating your pooled sample variance and your test statistic, assume the American League data is sample 1 and the National League data is sample 2.
space
|
Decision Rule |
-t < or t > = REJECT H0 |
|
Value of Pooled Sample Variances |
|
|
Value of test statistic |
|
|
Decision: enter Reject or Do Not Reject |
SPACE
Is there a difference in the mean attendance of teams in the American League vs. teams in the National League assuming a 0.05 level of significance? Enter Yes or No.
space
space
space
Another idea is to look at how a team's payroll impacts its home attendance. Higher payroll usually signals more higher-skilled players on a roster which should brings fans to the ballpark to see these players.
- Create 2 samples based on Team Salary and calculate average attendance, variance of attendance, and standard deviation of attendance for each sample.
- Sample 1 = 10 teams with the highest team salary
- Sample 2 = 10 teams with the lowest team salary
space
Tip: Use Excel's sorting tool to sort the data by salary (highest to lowest), and copy the 10 highest and 10 lowest into a separate part of the spreadsheet for easier analysis.
space
|
|
Sample 1 |
Sample 2 |
|
|
Top 10 Team Salary |
Bottom 10 Team Salary |
|
Sample mean attendance |
mil |
mil |
|
Sample attendance variance |
mil |
mil |
|
Sample attendance standard deviation |
mil |
mil |
space
space


Trending nowThis is a popular solution!

Step by stepSolved in 5 steps with 6 images


- 2. Please answer this question ASAP. Please circle all answers, please be organized.arrow_forwardNeed help with #14arrow_forwardListed below are pulse rates (beats per minute) from samples of adult males and females. Find the mean and median for each of the two samples and then compare the two sets of results. Does there appear to be a difference? Male: Female: 86 71 54 84 57 95 53 89 53 63 59 72 68 85 87 90 91 88 70 92 77 63 82 53 91 88 94 82 86 64 Find the means. The mean for males is ☐ beats per minute and the mean for females is (Type integers or decimals rounded to one decimal place as needed.) beats per minute.arrow_forward
- Listed below are pulse rates (beats per minute) from samples of adult males and females. Find the mean and median for each of the two samples and then compare the two sets of results. Does there appear to be a difference? Male: Female: 56 52 58 62 70 91 89 92 95 66 76 61 67 86 68 59 61 58 60 65 57 57 86 90 81 79 88 89 75 83 Find the means. The mean for males is beats per minute and the mean for females is beats per minute. (Type integers or decimals rounded to one decimal place as needed.)arrow_forwardA population data set produced the following information. N = 250. Ex = 9980, Ey = 1455, xy = 85,040 E2 = 486,820, and = 136,745 Find the values of oe and p?. Round oe to four decimal places and p? to three decimal places. iarrow_forward
- MATLAB: An Introduction with ApplicationsStatisticsISBN:9781119256830Author:Amos GilatPublisher:John Wiley & Sons Inc
 Probability and Statistics for Engineering and th...StatisticsISBN:9781305251809Author:Jay L. DevorePublisher:Cengage Learning
 Statistics for The Behavioral Sciences (MindTap C...StatisticsISBN:9781305504912Author:Frederick J Gravetter, Larry B. WallnauPublisher:Cengage Learning
  Elementary Statistics: Picturing the World (7th E...StatisticsISBN:9780134683416Author:Ron Larson, Betsy FarberPublisher:PEARSON
 The Basic Practice of StatisticsStatisticsISBN:9781319042578Author:David S. Moore, William I. Notz, Michael A. FlignerPublisher:W. H. Freeman
 Introduction to the Practice of StatisticsStatisticsISBN:9781319013387Author:David S. Moore, George P. McCabe, Bruce A. CraigPublisher:W. H. Freeman