FINANCIAL ACCOUNTING
10th Edition
ISBN: 9781259964947
Author: Libby
Publisher: MCG
expand_more
expand_more
format_list_bulleted
Question
How can I calculate using a financial indicator, which of the companies has the greatest possibility of obtaining more money borrowed from a bank?

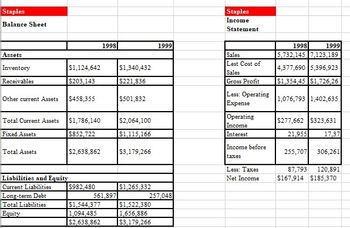
Transcribed Image Text:Staples
Balance Sheet
Assets
Inventory
Receivables
Other current Assets $458,355
$1,124,642
$203,143
Total Current Assets $1,786,140
Fixed Assets
$852,722
Total Assets
Liabilities and Equity
Current Liabilities
Long-term Debt
Total Liabilities
Equity
$2,638,862
$982,480
1998
561,897
$1,544,377
1,094,485
$2,638,862
$1,340,432
$221,836
$501,832
$2,064,100
|$1,115,166
$3,179,266
$1,265,332
$1,522,380
1,656,886
$3,179,266
1999
257,048
Staples
Income
Statement
Sales
Lest Cost of
Sales
Gross Profit
Less: Operating
Expense
Operating
Income
Interest
Income before
taxes
Less: Taxes
Net Income
1998
1999
|5,732,145 | 7,123,189
4,377,690 5,396,923
||$1,354,45|$1,726,26
1,076,793 1,402,635
$277,662 $323,631
21,955 17,37
255,707 306,261
87,793
120,891
$167,914 $185,370

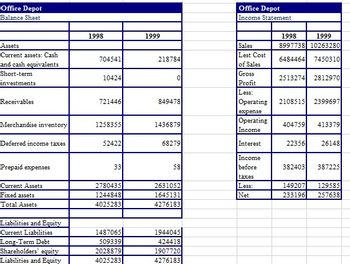
Transcribed Image Text:Office Depot
Balance Sheet
Assets
Current assets: Cash
and cash equivalents
Short-term
investments
Receivables
Merchandise inventory
Deferred income taxes
Prepaid expenses
Current Assets
Fixed assets
Total Assets
Liabilities and Equity
Current Liabilities
Long-Term Debt
Shareholders' equity
Liabilities and Equity
1998
704541
10424
721446
1258355
52422
33
2780435
1244848
4025283
1487065
509339
2028879
4025283
1999
218784
0
849478
1436879
68279
58
2631052
1645131
4276183
1944045
424418
1907720
4276183
Office Depot
Income Statement
Sales
Lest Cost
of Sales
Gross
Profit
Less:
Operating
expense
Operating
Income
Interest
Income
before
taxes
Less:
Net
1998
1999
8997738 10263280
6484464 7450310
2513274 2812970
2108515 2399697
404759
22356
413379
26148
382403 387225
149207
129585
233196 257638
Expert Solution
This question has been solved!
Explore an expertly crafted, step-by-step solution for a thorough understanding of key concepts.
Step by stepSolved in 3 steps

Follow-up Questions
Read through expert solutions to related follow-up questions below.
Follow-up Question
I don´t undertand why Office Depot has the greatest possibility if the Debt ratio is higher which means that the company has a higher indebtedness?? Sorry is my first course =(
Solution
by Bartleby Expert
Knowledge Booster
Learn more about
Need a deep-dive on the concept behind this application? Look no further. Learn more about this topic, accounting and related others by exploring similar questions and additional content below.Similar questions
- In managing credit risk for banks what are the two main concerns that banks have when lending money? Name them, and explain what these are, then give an overview of the tools banks use to mitigate credit risk.arrow_forwardExplain commercial banks’ brokerage and intermediation functions. Clearly detail how these functions help overcome the information costs, liquidity risk and price risk arising from financial investments.arrow_forwardwhat are some of the businesses that used credit card/s as their financial leverage?arrow_forward
- Describe how a bank makes a profit with its securities trading account. What are the risks?arrow_forwardis a financial product that allows an individual to lend their money to a bank A and be paid an interest rate for doing so.arrow_forward5. How will you treat Bank Overdraft in a Cash Flow Statement? (A) Cash Flow from Operating Activities' (B) Cash Flow from Investing Activities {C) Cash Equivalent (D) Cash Flow from Financing Activities.arrow_forward
- b) Why is the risk-adjusted return on capital (RAROC) an important tool in credit risk management for commercial banks?arrow_forwardWhich of the following would not represent a financing activity? a. Borrowing money from a bank to finance the purchase of new equipment. b. An investment of financial capital by the owners. c. Paying dividends to shareholders. d. Collecting cash from customers. Xarrow_forwardWhich statement best describes the role of a credit agency? OIt tracks the use of credit for lenders. It predicts future earning potential for lenders. OIt teaches how to make smart financial decisions. OIt shows how saving money makes financial sense.arrow_forward
- If a company is worried about having enough cash to pay interest to their bondholders, rent to their landlords and wages to their employees. they are having:a. Solvency issuesb. Liquidity issuesc. Duration matching issuesarrow_forwardA bank that grants loans to firms in a many different lines of business: will increase its information cost and decrease its credit risk will increase both its information cost and its credit risk will decrease its information cost and decerase its credit risk will decrease its information costs and increase its credit riskarrow_forwardwhat are the methods to maximize the use of credit card/s as financial leverage in your business?arrow_forward
arrow_back_ios
SEE MORE QUESTIONS
arrow_forward_ios
Recommended textbooks for you

 AccountingAccountingISBN:9781337272094Author:WARREN, Carl S., Reeve, James M., Duchac, Jonathan E.Publisher:Cengage Learning,
 Accounting Information SystemsAccountingISBN:9781337619202Author:Hall, James A.Publisher:Cengage Learning,
 Horngren's Cost Accounting: A Managerial Emphasis...AccountingISBN:9780134475585Author:Srikant M. Datar, Madhav V. RajanPublisher:PEARSON
 Intermediate AccountingAccountingISBN:9781259722660Author:J. David Spiceland, Mark W. Nelson, Wayne M ThomasPublisher:McGraw-Hill Education
 Financial and Managerial AccountingAccountingISBN:9781259726705Author:John J Wild, Ken W. Shaw, Barbara Chiappetta Fundamental Accounting PrinciplesPublisher:McGraw-Hill Education


Accounting
Accounting
ISBN:9781337272094
Author:WARREN, Carl S., Reeve, James M., Duchac, Jonathan E.
Publisher:Cengage Learning,

Accounting Information Systems
Accounting
ISBN:9781337619202
Author:Hall, James A.
Publisher:Cengage Learning,

Horngren's Cost Accounting: A Managerial Emphasis...
Accounting
ISBN:9780134475585
Author:Srikant M. Datar, Madhav V. Rajan
Publisher:PEARSON

Intermediate Accounting
Accounting
ISBN:9781259722660
Author:J. David Spiceland, Mark W. Nelson, Wayne M Thomas
Publisher:McGraw-Hill Education

Financial and Managerial Accounting
Accounting
ISBN:9781259726705
Author:John J Wild, Ken W. Shaw, Barbara Chiappetta Fundamental Accounting Principles
Publisher:McGraw-Hill Education