
MATLAB: An Introduction with Applications
6th Edition
ISBN: 9781119256830
Author: Amos Gilat
Publisher: John Wiley & Sons Inc
expand_more
expand_more
format_list_bulleted
Related questions
Question
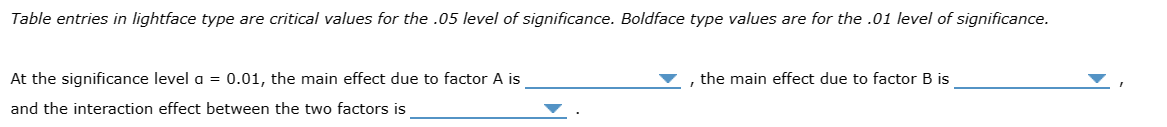

Transcribed Image Text:Table entries in lightface type are critical values for the .05 level of significance. Boldface type values are for the .01 level of significance.
At the significance level a = 0.01, the main effect due to factor A is
and the interaction effect between the two factors is
the main effect due to factor B is

Transcribed Image Text:You perform an ANOVA to test that there are no main effects of factor A, no main effects of factor B, and no interaction between factors A and B.
Some of the results are presented in the following ANOVA table.
Source
Between treatments
Factor A
Factor B
A X B interaction
Within treatments
Total
ANOVA Table
SS
6.5667
0.0667
12.1667
df
5
29
MS
4.0333
1.2334
F
17.29
5.29
Work through the following steps to complete the preceding ANOVA table.
1. The main effect for factor A evaluates the mean differences between the levels of factor A. The main effect for factor B evaluates the mean
differences between the levels of factor B. Select the correct values for the sums of squares for factors A and B in the ANOVA table.
2. Select the correct value for the within-treatments sum of squares in the ANOVA table.
3. Select the correct degrees of freedom for all the sums of squares in the ANOVA table.
4. Select the correct values for the mean square due to A X B interaction, the within treatments mean square, and the F-ratio for the A X B interaction.
5. Use the results from the completed ANOVA table and the F distribution table (click on the following dropdown menu to access the table) to make
the following conclusions.
Expert Solution
This question has been solved!
Explore an expertly crafted, step-by-step solution for a thorough understanding of key concepts.

This is a popular solution

Trending nowThis is a popular solution!

Step by stepSolved in 6 steps with 2 images

Knowledge Booster

Similar questions
- Calculate R2 and R2auj,, Showing your formulas clearly.arrow_forwardAssume the samples are random and independent, the populations are nomally distributed, and the population variances are equal. The table available below shows the prices (in dollars) for a sample of automobile batteries. The prices are classified according to battery type. At a = 0.10, is there enough evidence conclude that at least one mean battery price is different from the others? Complete parts (a) through (e) below. E Click the icon to view the battery cost data. (a) Let u1. P2. H3 represent the mean prices for the group size 35, 65, and 24/24F respectively. Identify the claim and state Ho and H. H Cost of batteries by type The claim is the V hypothesis. Group size 35 Group size 65 Group size 24/24F 101 111 121 124 D 146 173 182 278 124 140 141 89 (b) Find the critical value, Fo, and identify the rejection region. 90 79 84 The rejection region is F Fo, where Fo = (Round to two decimal places as needed.) (c) Find the test statistic F. Print Done F= (Round to two decimal places as…arrow_forwardOlease show all your workarrow_forward
- An experiment was carried out to compare the sound distortion produced by 4 different types of coating on magnetic tape. The ANOVA table for this data is given below, where X indicates a missing value. Source Degrees of Freedom Sum of Squares Mean Squares IF Treatment X 14.49 X Error X X X Total 49 165.69 Compute the F statistic. Give your answer to 2 decimal places.arrow_forwardA repeated measures ANOVA produced the partially completed ANOVA summary table below. Use this data to find the correct F-ratio. *image 5.80 20.74 5.68 19.22arrow_forwardplease answer in text form and in proper format answer with must explanation , calculation for each part and steps clearlyarrow_forward
arrow_back_ios
arrow_forward_ios
Recommended textbooks for you
- MATLAB: An Introduction with ApplicationsStatisticsISBN:9781119256830Author:Amos GilatPublisher:John Wiley & Sons Inc
 Probability and Statistics for Engineering and th...StatisticsISBN:9781305251809Author:Jay L. DevorePublisher:Cengage Learning
 Statistics for The Behavioral Sciences (MindTap C...StatisticsISBN:9781305504912Author:Frederick J Gravetter, Larry B. WallnauPublisher:Cengage Learning
  Elementary Statistics: Picturing the World (7th E...StatisticsISBN:9780134683416Author:Ron Larson, Betsy FarberPublisher:PEARSON
 The Basic Practice of StatisticsStatisticsISBN:9781319042578Author:David S. Moore, William I. Notz, Michael A. FlignerPublisher:W. H. Freeman
 Introduction to the Practice of StatisticsStatisticsISBN:9781319013387Author:David S. Moore, George P. McCabe, Bruce A. CraigPublisher:W. H. Freeman
MATLAB: An Introduction with Applications
Statistics
ISBN:9781119256830
Author:Amos Gilat
Publisher:John Wiley & Sons Inc
Probability and Statistics for Engineering and th...
Statistics
ISBN:9781305251809
Author:Jay L. Devore
Publisher:Cengage Learning
Statistics for The Behavioral Sciences (MindTap C...
Statistics
ISBN:9781305504912
Author:Frederick J Gravetter, Larry B. Wallnau
Publisher:Cengage Learning
Elementary Statistics: Picturing the World (7th E...
Statistics
ISBN:9780134683416
Author:Ron Larson, Betsy Farber
Publisher:PEARSON
The Basic Practice of Statistics
Statistics
ISBN:9781319042578
Author:David S. Moore, William I. Notz, Michael A. Fligner
Publisher:W. H. Freeman
Introduction to the Practice of Statistics
Statistics
ISBN:9781319013387
Author:David S. Moore, George P. McCabe, Bruce A. Craig
Publisher:W. H. Freeman