
A First Course in Probability (10th Edition)
10th Edition
ISBN: 9780134753119
Author: Sheldon Ross
Publisher: PEARSON
expand_more
expand_more
format_list_bulleted
Related questions
Concept explainers
Question
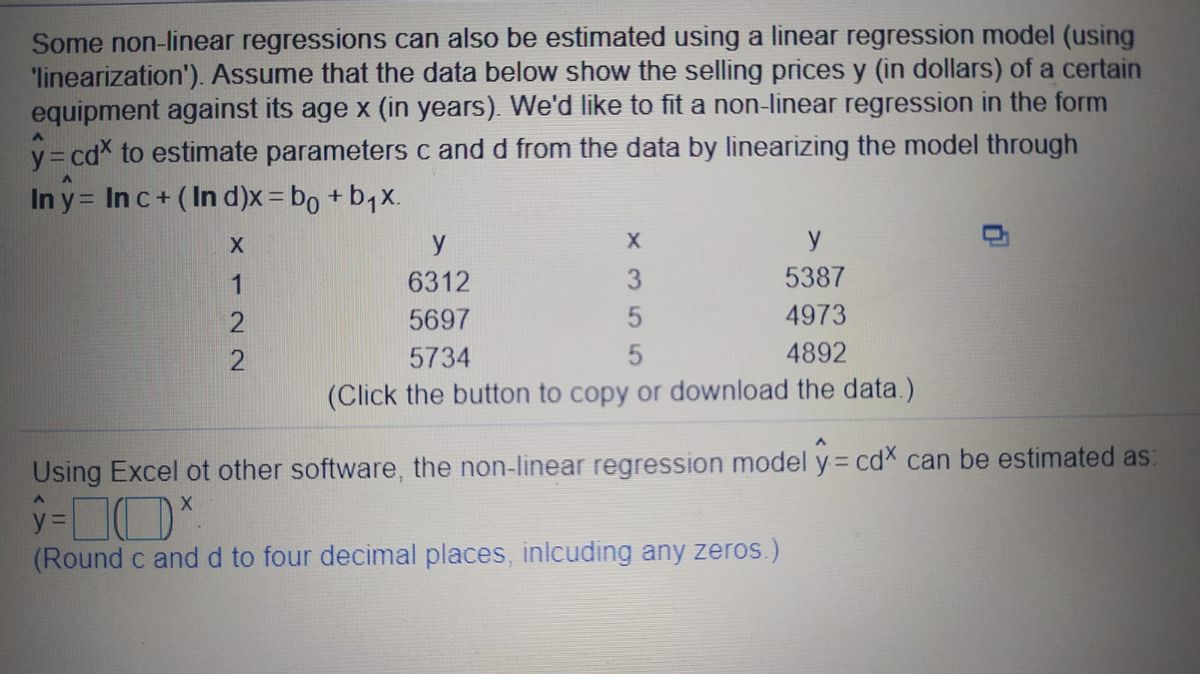

Transcribed Image Text:Some non-linear regressions can also be estimated using a linear regression model (using
"linearization'). Assume that the data below show the selling prices y (in dollars) of a certain
equipment against its age x (in years). We'd like to fit a non-linear regression in the form
y= cd to estimate parameters c and d from the data by linearizing the model through
In y= In c+ (In d)x = bo + b,x.
y
y
1
6312
5387
5697
4973
5734
4892
(Click the button to copy or download the data.)
Using Excel ot other software, the non-linear regression model y = cdX can be estimated as:
(Round c and d to four decimal places, inlcuding any zeros.)
Expert Solution
This question has been solved!
Explore an expertly crafted, step-by-step solution for a thorough understanding of key concepts.

Step by stepSolved in 2 steps with 2 images

Knowledge Booster


Learn more about
Need a deep-dive on the concept behind this application? Look no further. Learn more about this topic, probability and related others by exploring similar questions and additional content below.Similar questions
- A negative correlation between variables X and Y will always result in a positive slope in the linear regression model. Cannot tell from the given information. False Truearrow_forwardFinally, the researcher considers using regression analysis to establish a linear relationship between the two variables – hours worked per week and yearly income. (a) Estimate a simple linear regression model and present the estimated linear equation. Display the regression summary table and interpret the intercept and slope coefficient estimates of the linear model. (b) Display and interpret the value of the coefficient of determination, R-squared (R2). Data Hours Per Week Yearly Income ('000's) Class 18 43.8 13 44.5 18 44.8 25.5 46.0 11.5 41.2 18 43.3 16 43.6 27 46.2 27.5 46.8 30.5 48.2 24.5 49.3 32.5 53.8 25 53.9 23.5 54.2 30.5 50.5 27.5 51.2 28 51.5 26 52.6 25.5 52.8 26.5 52.9 33 49.5 15 49.8 27.5 50.3 36 54.3 27 55.1 34.5 55.3 39 61.7 37 62.3 31.5 63.4 37 63.7 24.5 55.5 28 55.6 19 55.7 38.5 58.2 37.5 58.3 18.5 58.4 32 59.2 35…arrow_forwardHormone replacement therapy (HRT) is thought to increase the risk of breast cancer. The accompanying data on x = percent of women using HRT and y = breast cancer incidence (cases per 100,000 women) for a region in Germany for 5 years appeared in the paper "Decline in Breast Cancer Incidence after Decrease in Utilization of Hormone Replacement Therapy." The authors of the paper used a simple linear regression model to describe the relationship between HRT use and breast cancer incidence. HRT Use Breast Cancer Incidence 46.30 103.30 40.60 105.00 39.50 100.00 36.60 93.80 30.00 83.50 n USE SALT (a) What is the equation of the estimated regression line? (Round your numerical values to four decimal places.) ý = 45.5727 + (1.3354 )x (b) What is the estimated average change in breast cancer incidence (in cases per 100,000 women) associated with a 1 percentage point increase in HRT use? (Round your answer to four decimal places.) 1.3354 cases per 100,000 women (c) What breast cancer incidence…arrow_forward
- A biologist looked at the relationship between number of seeds a plant produces and the percent of those seeds that sprout. The results of the survey are shown below. Seeds Produced 61 59 60 51 54 67 58 Sprout Percent 49.5 55.5 65 70.5 60 47.5 68 The equation of the linear regression line is: ˆyy^ = Incorrect + Incorrectxx (Please show your answers to two decimal places) Use the model to predict the percent of seeds that sprout if the plant produces 53 seeds.Percent sprouting = Incorrect (Please round your answer to the nearest whole number.)arrow_forwardThe authors of the paper "Power-Load Prediction Based on Multiple Linear Regression Model"t were interested in predicting the load on the electric power system in China using data on y = Power consumption (in hundreds of millions of kwh), x, Population (in millions), and x, = Gross domestic %3D product (in billions of dollars), for 21 years. The model equation proposed in the paper is y = -113,527 + 0.974x, + 0.057x, + e. (a) According to this model, what is the mean power consumption (in hundreds of millions of kwh) for a year if the population was 160,000 million and the gross domestic product was 600,000 billion dollars? hundreds of millions of kwh (b) Interpret the value of B, in this model. When the [ gross domestic product v is fixed, the mean increase in [power consumption (in hundreds of millions of kwh) V associated with a 1-million unit increase in [population is 0.974.arrow_forwardCanada's trade balance with the rest of the world has been steadily increasing over the past several years. It is well known that the U.S. is Canada's leading trade partner. Is there a predictable linear relationship between our total trade balance and our trade balance with the U.S.? Develop a regression model to predict the trade balance with the U.S. by our trade balance with the rest of the world. Comment on the strength of the model. Develop a time-series trend line for trade balance with the rest of the world by using the time periods given. Forecast total trade balance with the rest of the world for 2020 using this equation. Trade Balance ($ millions) Year Rest of the World U.S. 2010 2,290 4,991 2011 2,486 4,709 2012 2,776 4,641 2013 2,648 5,220 2014 3,068 5,041 2015 3,688 4,750 2016 4,111 4,321 2017 4,172 4,699 2018 3,669 4,777 2019 3,493 4,809 question 1: y̅ = ?+?x question…arrow_forward
- also compute the regression equation in which you predict Y using X as the predictor variablearrow_forwardThe relationship between the entrance exam score (x) of MBA students and their GPA (y) upon graduation is given by ŷ = -0. 57 +0. 013x Based on this model, the predicted GPA of a student who had 200 for the entrance exam score is (Keep 2 decimal places) and the value of the slope of this fitted regression line is (Keep all the decimal places)arrow_forwardA researcher knows that people with higher annual salaries commit fewer crimes. He is creating a regression model to predict the number of crimes a person will commit based on their salary Based on this information alone which of the following MUST be the slope of the regression line choose one 1.00 or 0.50 or -0.50arrow_forward
- Select all the charts that violate the conditions for linear regression. These are residual plots so the red line represents the average residual, zero. 미 Od (a) (d) 매 Get help: Video (b) (e) (c) (1)arrow_forwardHormone replacement therapy (HRT) is thought to increase the risk of breast cancer. The accompanying data on x = percent of women using HRT and y = breast cancer incidence (cases per 100,000 women) for a region in Germany for 5 years appeared in the paper "Decline in Breast Cancer Incidence after Decrease in Utilization of Hormone Replacement Therapy." The authors of the paper used a simple linear regression model to describe the relationship between HRT use and breast cancer incidence. t HRT Use Breast Cancer Incidence 46.30 40.60 39.50 36.60 30.00 103.30 105.00 100.00 93.80 83.50 (a) What is the equation of the estimated regression line? (Round your numerical values to four decimal places.) ŷ = (b) What is the estimated average change in breast cancer incidence (in cases per 100,000 women) associated with a 1 percentage point increase in HRT use? (Round your answer to four decimal places.) cases per 100,000 women (c) What breast cancer incidence (in cases per 100,000 women) would be…arrow_forwardA weight-loss clinic wants to use regression analysis to build a model for weight loss of a client (measured in pounds), Two variables thought to affect weight loss are client's length of time on the weight-loss program and time of session These variables are described below: Y-BO+B1'X+82'D 83'X'D+E Y-Weight loss (in pounds) X- Length of time in weight-loss program (in months) D-1 if morning session. O if not in terms of the Bs in the model, what is the difference between the weight loss of an individual who has spent 3 months in the program when attending the morning session, and an individual who has spent 2 months in the program when attending the evening session? OB1+83 OB1+82-83 OB1+82+283 O81+82+383arrow_forward
arrow_back_ios
SEE MORE QUESTIONS
arrow_forward_ios
Recommended textbooks for you
- A First Course in Probability (10th Edition)ProbabilityISBN:9780134753119Author:Sheldon RossPublisher:PEARSON

A First Course in Probability (10th Edition)
Probability
ISBN:9780134753119
Author:Sheldon Ross
Publisher:PEARSON