
ENGR.ECONOMIC ANALYSIS
14th Edition
ISBN: 9780190931919
Author: NEWNAN
Publisher: Oxford University Press
expand_more
expand_more
format_list_bulleted
Related questions
Question
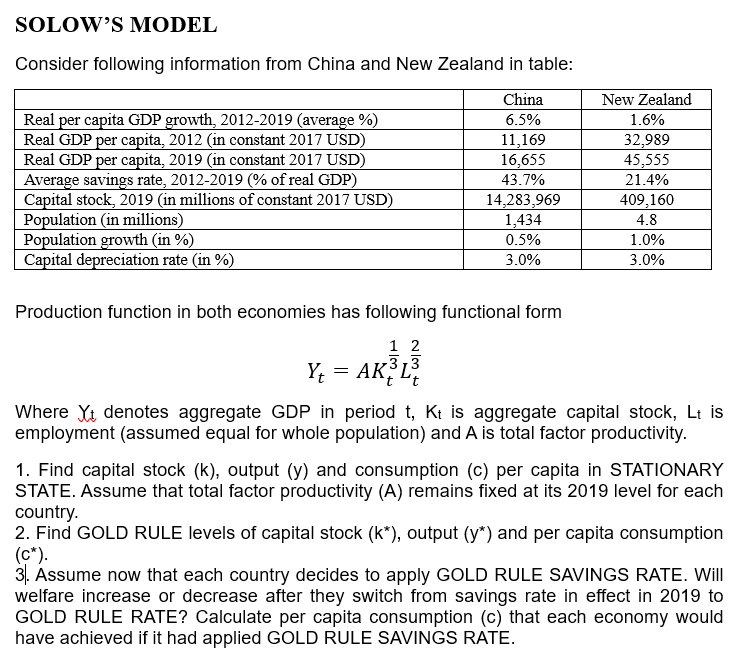

Transcribed Image Text:SOLOW'S MODEL
Consider following information from China and New Zealand in table:
China
6.5%
Real per capita GDP growth, 2012-2019 (average %)
Real GDP per capita, 2012 (in constant 2017 USD)
Real GDP per capita, 2019 (in constant 2017 USD)
Average savings rate, 2012-2019 (% of real GDP)
Capital stock, 2019 (in millions of constant 2017 USD)
Population (in millions)
Population growth (in %)
Capital depreciation rate (in %)
11,169
16,655
43.7%
14,283,969
1,434
0.5%
3.0%
Production function in both economies has following functional form
1 2
Yt = AK³L³
New Zealand
1.6%
32,989
45,555
21.4%
409,160
4.8
1.0%
3.0%
Where Yt denotes aggregate GDP in period t, Kt is aggregate capital stock, Lt is
employment (assumed equal for whole population) and A is total factor productivity.
1. Find capital stock (k), output (y) and consumption (c) per capita in STATIONARY
STATE. Assume that total factor productivity (A) remains fixed at its 2019 level for each
country.
2. Find GOLD RULE levels of capital stock (k*), output (y*) and per capita consumption
(C*).
3. Assume now that each country decides to apply GOLD RULE SAVINGS RATE. Will
welfare increase or decrease after they switch from savings rate in effect in 2019 to
GOLD RULE RATE? Calculate per capita consumption (c) that each economy would
have achieved if it had applied GOLD RULE SAVINGS RATE.
Expert Solution
This question has been solved!
Explore an expertly crafted, step-by-step solution for a thorough understanding of key concepts.

Step by stepSolved in 5 steps with 4 images

Knowledge Booster


Learn more about
Need a deep-dive on the concept behind this application? Look no further. Learn more about this topic, economics and related others by exploring similar questions and additional content below.Similar questions
- Productivity and growth policies Consider a hypothetical small island nation in which the only industry is cloud computing. The following table displays information about the economy over a two year period. Complete the table by calculating physical capital per worker as well as labor productivity. Hint: Recall that productivity is defined as the amount of goods and services a worker can produce per hour. In this problem, measure productivity as the quantity of goods per hour of labor. Year 2039 2040 Physical Capital (Servers) 200 480 Labor Force (Workers) Based on your calculations, productivity from 2039 to 2040. 100 120 Physical Capital per Worker (Servers) Labor Hours (Hours) 4,500 4,200 in physical capital per worker from 2039 to 2040 is asociated with Suppose you're in charge of establishing economic policy for this small island country. Output (TB of data storage) 40,500 75,600 Imposing restrictions on foreign ownership of domestic capital Subsidizing research and development…arrow_forward> Consider the data in the table below: Per capita GDP, 2017 Saving rate (%) TFP (Ā) United States 1.000 23.5 1.000 Switzerland 1.151 28.8 1.052 Answer the following questions using the Solow growth model. 9. Assuming no differences in TFP (ignore the last column) and no differences in the rate of depreciation between the U.S. and Switzerland, use the data in the table to predict the ratio of per capita GDP of Switzerland relative to that of the U.S. in the steady states. How much percent richer is Switzerland than the U.S. in steady state? 10. Now do the same exercise assuming TFP is given by the levels in the last column. Now how much percent richer is Switzerland than the U.S. in steady state? Consider the data in the table below: Per сapita GDP, 2017arrow_forwardHi, I'm having trouble answering this Macroeconomics question, please help. Thank you!arrow_forward
- in england, suppose GDP per capita grows by 3.0% per year for 19 years. by how many times does this economy grow?arrow_forwardPlease answer all the questions below with a detailed and 100% correct solution.arrow_forwardWe measure standards of living using GDP per capita. Using the production function, which of the following factors does NOT help to explain differences in GDP per capita between countries: human capital per worker productivity inflation rates physical capital per workerarrow_forward
arrow_back_ios
arrow_forward_ios
Recommended textbooks for you
 Principles of Economics (12th Edition)EconomicsISBN:9780134078779Author:Karl E. Case, Ray C. Fair, Sharon E. OsterPublisher:PEARSON
 Engineering Economy (17th Edition)EconomicsISBN:9780134870069Author:William G. Sullivan, Elin M. Wicks, C. Patrick KoellingPublisher:PEARSON
 Principles of Economics (MindTap Course List)EconomicsISBN:9781305585126Author:N. Gregory MankiwPublisher:Cengage Learning
 Managerial Economics: A Problem Solving ApproachEconomicsISBN:9781337106665Author:Luke M. Froeb, Brian T. McCann, Michael R. Ward, Mike ShorPublisher:Cengage Learning
 Managerial Economics & Business Strategy (Mcgraw-...EconomicsISBN:9781259290619Author:Michael Baye, Jeff PrincePublisher:McGraw-Hill Education
Principles of Economics (12th Edition)
Economics
ISBN:9780134078779
Author:Karl E. Case, Ray C. Fair, Sharon E. Oster
Publisher:PEARSON
Engineering Economy (17th Edition)
Economics
ISBN:9780134870069
Author:William G. Sullivan, Elin M. Wicks, C. Patrick Koelling
Publisher:PEARSON
Principles of Economics (MindTap Course List)
Economics
ISBN:9781305585126
Author:N. Gregory Mankiw
Publisher:Cengage Learning
Managerial Economics: A Problem Solving Approach
Economics
ISBN:9781337106665
Author:Luke M. Froeb, Brian T. McCann, Michael R. Ward, Mike Shor
Publisher:Cengage Learning
Managerial Economics & Business Strategy (Mcgraw-...
Economics
ISBN:9781259290619
Author:Michael Baye, Jeff Prince
Publisher:McGraw-Hill Education