MATLAB: An Introduction with Applications
6th Edition
ISBN: 9781119256830
Author: Amos Gilat
Publisher: John Wiley & Sons Inc
expand_more
expand_more
format_list_bulleted
Concept explainers
Question

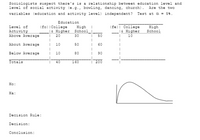
Transcribed Image Text:Sociologists suspect there's is a relationship between education level and
level of social activity (e.g., bowling, dancing, church).
Are the twO
variables (education and activity level) independent? Test at a = 54.
Education
(fo) ICollege
(fe)l College
l& Higher
High
School
Level of
High
Activity
Above Average
1E Higher School_
20
30
50
10
About Average
10
50
60
Below Average
10
80
90
Iotals
40
160
200
Ho:
Ha:
Decision Rule:
Decision:
Conclusion:
Expert Solution
This question has been solved!
Explore an expertly crafted, step-by-step solution for a thorough understanding of key concepts.
Step by stepSolved in 2 steps with 3 images

Knowledge Booster
Learn more about
Need a deep-dive on the concept behind this application? Look no further. Learn more about this topic, statistics and related others by exploring similar questions and additional content below.Similar questions
- Which variable is most likely to be an independent variable? reading test score stress level running speed weight loss forms of therapyarrow_forward1. A study comparing children's height to their reading level showed that 70% of children who were less than 48 inches tall had a reading level at or below 4th grade, while 80% of children who were 48 inches or taller had a reading level above 4th grade. There are 200 students total, and 110 of them are less than 48 inches tall.arrow_forwardreview(7a): The following table summarizes the outcome of a study that researchers carried to determine if females expressed a greater fear of heights than male. How many categorical variables are summarized in the table? Men Women Expressed fear for heights 68 109 did not expressed a fear for heights 94 89arrow_forward
- Speak Calculate the mode, mean, and median of the following data: 19, 16, 16, 10, 999, 14, 16, 919, 16, 16, 10, 999, 14, 16, 9 Which measure of center does not work well here?A. MedianB. ModeC. MeanD. All of the abovearrow_forwardMonthly telephone charges for cell phone in the United States are normally distributed with a mean of $62 for a single user. Coach Keefer thinks that leasing smart phones has increased the monthly cell phone bill for a single user. H: μ- 62 H : μ 62 O Ho : µ= 62 H : μ> 62 O Ho : µ= 62 H : μ 62 a O Ho : 62 Ha : ữ + 62arrow_forwardWhat is the coefficient of the dummy variable? What is the meaning of the coefficient of the dummy variable?arrow_forward
arrow_back_ios
arrow_forward_ios
Recommended textbooks for you
 MATLAB: An Introduction with ApplicationsStatisticsISBN:9781119256830Author:Amos GilatPublisher:John Wiley & Sons Inc
 Probability and Statistics for Engineering and th...StatisticsISBN:9781305251809Author:Jay L. DevorePublisher:Cengage Learning
 Statistics for The Behavioral Sciences (MindTap C...StatisticsISBN:9781305504912Author:Frederick J Gravetter, Larry B. WallnauPublisher:Cengage Learning
 Elementary Statistics: Picturing the World (7th E...StatisticsISBN:9780134683416Author:Ron Larson, Betsy FarberPublisher:PEARSON
 The Basic Practice of StatisticsStatisticsISBN:9781319042578Author:David S. Moore, William I. Notz, Michael A. FlignerPublisher:W. H. Freeman
 Introduction to the Practice of StatisticsStatisticsISBN:9781319013387Author:David S. Moore, George P. McCabe, Bruce A. CraigPublisher:W. H. Freeman

MATLAB: An Introduction with Applications
Statistics
ISBN:9781119256830
Author:Amos Gilat
Publisher:John Wiley & Sons Inc

Probability and Statistics for Engineering and th...
Statistics
ISBN:9781305251809
Author:Jay L. Devore
Publisher:Cengage Learning

Statistics for The Behavioral Sciences (MindTap C...
Statistics
ISBN:9781305504912
Author:Frederick J Gravetter, Larry B. Wallnau
Publisher:Cengage Learning

Elementary Statistics: Picturing the World (7th E...
Statistics
ISBN:9780134683416
Author:Ron Larson, Betsy Farber
Publisher:PEARSON

The Basic Practice of Statistics
Statistics
ISBN:9781319042578
Author:David S. Moore, William I. Notz, Michael A. Fligner
Publisher:W. H. Freeman

Introduction to the Practice of Statistics
Statistics
ISBN:9781319013387
Author:David S. Moore, George P. McCabe, Bruce A. Craig
Publisher:W. H. Freeman