
MATLAB: An Introduction with Applications
6th Edition
ISBN: 9781119256830
Author: Amos Gilat
Publisher: John Wiley & Sons Inc
expand_more
expand_more
format_list_bulleted
Related questions
Question
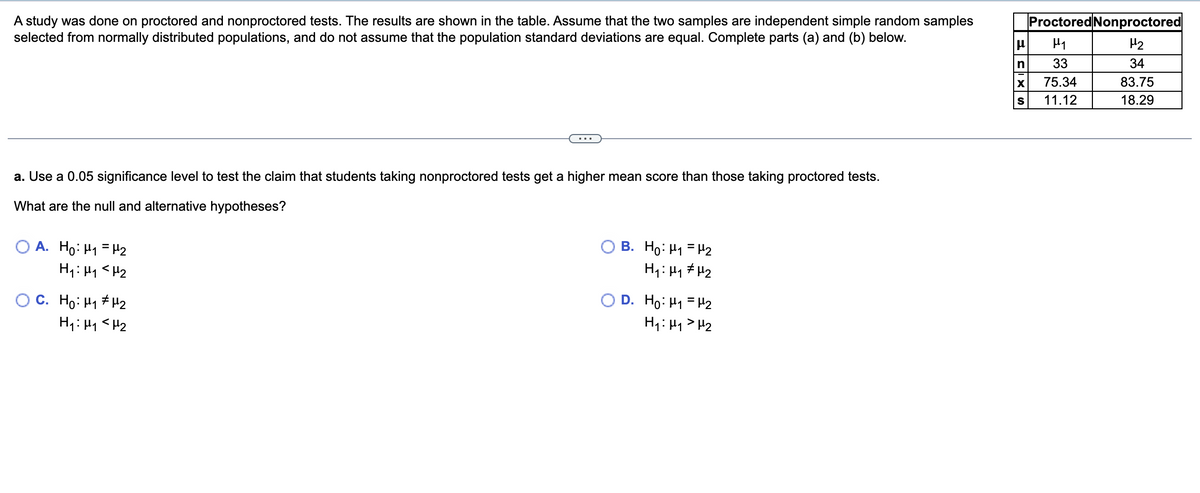

Transcribed Image Text:**Study on Proctored and Nonproctored Tests**
A study was done on proctored and nonproctored tests. The results are shown in the table below. Assume that the two samples are independent simple random samples selected from normally distributed populations, and do not assume that the population standard deviations are equal. Complete parts (a) and (b) below.
| | Proctored | Nonproctored |
|------------------|-----------|--------------|
| μ | μ₁ | μ₂ |
| n | 33 | 34 |
| x̄ | 75.34 | 83.75 |
| s | 11.12 | 18.29 |
**a. Use a 0.05 significance level to test the claim that students taking nonproctored tests get a higher mean score than those taking proctored tests.**
What are the null and alternative hypotheses?
A.
- H₀: μ₁ = μ₂
- H₁: μ₁ < μ₂
B.
- H₀: μ₁ = μ₂
- H₁: μ₁ ≠ μ₂
C.
- H₀: μ₁ ≠ μ₂
- H₁: μ₁ < μ₂
D.
- H₀: μ₁ = μ₂
- H₁: μ₁ > μ₂
Expert Solution
arrow_forward
Step 1
Given,
For protected groups:
sample size (n1) = 33
sample mean (x̄1) = 75.34
sample standard deviation (s1) = 11.12
For non-protected group :
sample size (n2) = 34
sample mean (x̄2) = 83.75
sample standard deviation (s2) = 18.29

Step by stepSolved in 3 steps with 1 images

Knowledge Booster

Similar questions
- Question 10 For a confidence level of 90% with a sample size of 31, find the critical t value. Submit Question •Previous on 1.jpgarrow_forwardIf n=330 and ˆpp^ (p-hat) =0.28, find the margin of error at a 90% confidence levelGive your answer to three decimalsarrow_forwardPlease show the bell curve illustrations and please show ever step. Please do not skip a step so I can fully understand step-by-step how to solve the problem. Thank you!arrow_forward
- If n=200 and ˆpp^ (p-hat) =0.16, find the margin of error at a 95% confidence levelGive your answer to three decimalsarrow_forwardQuestion 4 Previous Ne QUESTION 28 A manufacturer measures 19 randomly selected dowels and finds the standard deviation of the sample to be s 0.16. Find the 95% confidence interval for the population variance. A) (0.0146, 0.2370) B) (0.0146, 0.0560) C) (0.1210, 0.2370) D) (0.0210, 0.0560) Aarrow_forwardIf n=130 and ˆpp^ (p-hat) =0.19, find the margin of error at a 95% confidence levelGive your answer to three decimalsarrow_forward
arrow_back_ios
arrow_forward_ios
Recommended textbooks for you
- MATLAB: An Introduction with ApplicationsStatisticsISBN:9781119256830Author:Amos GilatPublisher:John Wiley & Sons Inc
 Probability and Statistics for Engineering and th...StatisticsISBN:9781305251809Author:Jay L. DevorePublisher:Cengage Learning
 Statistics for The Behavioral Sciences (MindTap C...StatisticsISBN:9781305504912Author:Frederick J Gravetter, Larry B. WallnauPublisher:Cengage Learning
  Elementary Statistics: Picturing the World (7th E...StatisticsISBN:9780134683416Author:Ron Larson, Betsy FarberPublisher:PEARSON
 The Basic Practice of StatisticsStatisticsISBN:9781319042578Author:David S. Moore, William I. Notz, Michael A. FlignerPublisher:W. H. Freeman
 Introduction to the Practice of StatisticsStatisticsISBN:9781319013387Author:David S. Moore, George P. McCabe, Bruce A. CraigPublisher:W. H. Freeman
MATLAB: An Introduction with Applications
Statistics
ISBN:9781119256830
Author:Amos Gilat
Publisher:John Wiley & Sons Inc
Probability and Statistics for Engineering and th...
Statistics
ISBN:9781305251809
Author:Jay L. Devore
Publisher:Cengage Learning
Statistics for The Behavioral Sciences (MindTap C...
Statistics
ISBN:9781305504912
Author:Frederick J Gravetter, Larry B. Wallnau
Publisher:Cengage Learning
Elementary Statistics: Picturing the World (7th E...
Statistics
ISBN:9780134683416
Author:Ron Larson, Betsy Farber
Publisher:PEARSON
The Basic Practice of Statistics
Statistics
ISBN:9781319042578
Author:David S. Moore, William I. Notz, Michael A. Fligner
Publisher:W. H. Freeman
Introduction to the Practice of Statistics
Statistics
ISBN:9781319013387
Author:David S. Moore, George P. McCabe, Bruce A. Craig
Publisher:W. H. Freeman