
MATLAB: An Introduction with Applications
6th Edition
ISBN: 9781119256830
Author: Amos Gilat
Publisher: John Wiley & Sons Inc
expand_more
expand_more
format_list_bulleted
Related questions
Question
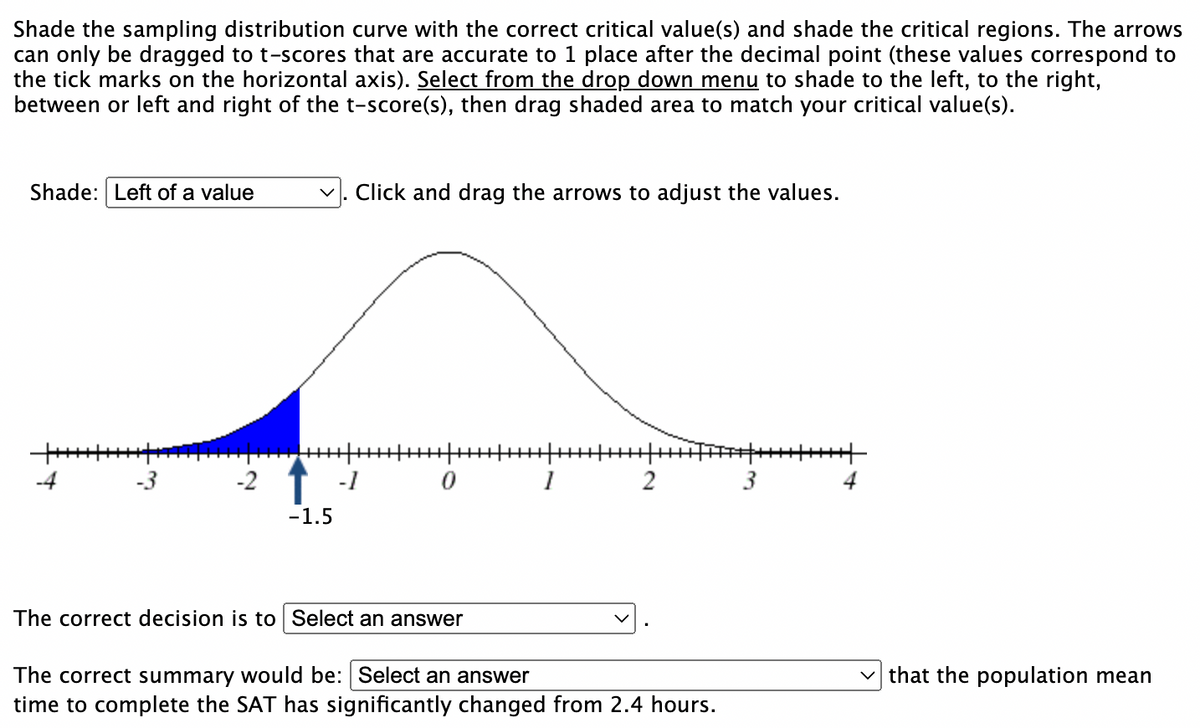

Transcribed Image Text:Shade the sampling distribution curve with the correct critical value(s) and shade the critical regions. The arrows
can only be dragged to t-scores that are accurate to 1 place after the decimal point (these values correspond to
the tick marks on the horizontal axis). Select from the drop down menu to shade to the left, to the right,
between or left and right of the t-score(s), then drag shaded area to match your critical value(s).
Shade: Left of a value
+++++
-4
-3
-2
-1.5
Click and drag the arrows to adjust the values.
0
The correct decision is to Select an answer
1
2
The correct summary would be: Select an answer
time to complete the SAT has significantly changed from 2.4 hours.
3
that the population mean

Transcribed Image Text:The time to complete the Advanced Placement (AP) Statistics Exam in previous years is normally distributed with
an average time of 2.4 hours. Because of school closures due to COVID-19, the College Board offered an at-
home test for the 2020 AP Statistics Exam. A teacher feels that students, on average, will have a different
completion time for the at-home exam. They take a random sample of 27 students that took the exam and
their mean time was 2.74 hours with a standard deviation of 0.3 hours. Test to see if the mean time has
significantly changed using a 5% level of significance. Give answers to at least 4 decimal places.
Expert Solution
This question has been solved!
Explore an expertly crafted, step-by-step solution for a thorough understanding of key concepts.

This is a popular solution

Trending nowThis is a popular solution!

Step by stepSolved in 2 steps with 4 images

Knowledge Booster

Similar questions
- A traffic safety company publishes reports about motorcycle fatalities and helmet use. In the first accompanying data table, the distribution shows the proportion of fatalities by location of injury for motorcycle accidents. The second data table shows the location of injury and fatalities for 2061 riders not wearing a helmet. Complete parts (a) and (b) below. Click the icon to view the tables. (a) Does the distribution of fatal injuries for riders not wearing a helmet follow the distribution for all riders? Use α = 0.05 level of significance. What are the null and alternative hypotheses? O A. Ho: The distribution of fatal injuries for riders not wearing a helmet follows the same distribution for all other riders. H₁: The distribution of fatal injuries for riders not wearing a helmet does not follow the same distribution for all other riders. B. Ho: The distribution of fatal injuries for riders not wearing a helmet does not follow the same distribution for all other riders. H₁: The…arrow_forwardClassify the data as either discrete or continuous.The number of freshmen entering college in a certain year is 621. Group of answer choices Discrete Continuousarrow_forwardhe data set below shows the ages of a random sample of children under the age of 14 who live in an apartment uilding. dake a dot plot to display the data. Children's Ages 7,4,7,7,2, 10, 12, 8, 7, 4arrow_forward
- Please indicate whether the above scatter plot indicates an r value that is: a. close to r=-1 b. close to r=+1 с. clearly negative but not near r = -1 d. clearly positive but not near r = +1arrow_forwardBianca is a swimmer training for a competition. The number of 50-metre laps she swam each day for 30 days are as follows: 22, 21, 24, 19, 27, 28, 24, 25, 29, 28, 26, 31, 28, 27, 22, 39, 20, 10, 26, 24, 27, 28, 26, 28, 18, 32, 29, 25, 31, 27.Draw the stem and leaf plot by splitting the stems into five-unit intervals. Explain what the plot shows.arrow_forward(6) Below is the exam score for 11 students: 90, 83, 89, 66, 80, 87, 95, 94, 70, 92, 83 Construct a stem-and-leaf plot for the data set, using the tenth digit as the stem and the unit digit as the leaf.arrow_forward
- A physics professor wishes to compare quiz grades between her two classes. The quiz was worth 10 points. The dot plots show the grade distributions. 4 10 9. Class A 10 Class B Each dot represents a What was the lowest quiz grade in Class A? What was the highest quiz grade in Class 8?arrow_forwardUse the box plot below to find each of the values: Minimum: First Quartile (Q1): Median: + 86 90 70 74 78 82 94 Third Quartile (Q3): Math Test Scores Maximum: Interquartile Range (IQR = Q3-Q1):arrow_forward
arrow_back_ios
arrow_forward_ios
Recommended textbooks for you
- MATLAB: An Introduction with ApplicationsStatisticsISBN:9781119256830Author:Amos GilatPublisher:John Wiley & Sons Inc
 Probability and Statistics for Engineering and th...StatisticsISBN:9781305251809Author:Jay L. DevorePublisher:Cengage Learning
 Statistics for The Behavioral Sciences (MindTap C...StatisticsISBN:9781305504912Author:Frederick J Gravetter, Larry B. WallnauPublisher:Cengage Learning
  Elementary Statistics: Picturing the World (7th E...StatisticsISBN:9780134683416Author:Ron Larson, Betsy FarberPublisher:PEARSON
 The Basic Practice of StatisticsStatisticsISBN:9781319042578Author:David S. Moore, William I. Notz, Michael A. FlignerPublisher:W. H. Freeman
 Introduction to the Practice of StatisticsStatisticsISBN:9781319013387Author:David S. Moore, George P. McCabe, Bruce A. CraigPublisher:W. H. Freeman
MATLAB: An Introduction with Applications
Statistics
ISBN:9781119256830
Author:Amos Gilat
Publisher:John Wiley & Sons Inc
Probability and Statistics for Engineering and th...
Statistics
ISBN:9781305251809
Author:Jay L. Devore
Publisher:Cengage Learning
Statistics for The Behavioral Sciences (MindTap C...
Statistics
ISBN:9781305504912
Author:Frederick J Gravetter, Larry B. Wallnau
Publisher:Cengage Learning
Elementary Statistics: Picturing the World (7th E...
Statistics
ISBN:9780134683416
Author:Ron Larson, Betsy Farber
Publisher:PEARSON
The Basic Practice of Statistics
Statistics
ISBN:9781319042578
Author:David S. Moore, William I. Notz, Michael A. Fligner
Publisher:W. H. Freeman
Introduction to the Practice of Statistics
Statistics
ISBN:9781319013387
Author:David S. Moore, George P. McCabe, Bruce A. Craig
Publisher:W. H. Freeman