FINANCIAL ACCOUNTING
10th Edition
ISBN: 9781259964947
Author: Libby
Publisher: MCG
expand_more
expand_more
format_list_bulleted
Question

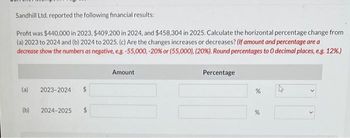
Transcribed Image Text:Sandhill Ltd. reported the following financial results:
Profit was $440,000 in 2023, $409,200 in 2024, and $458,304 in 2025. Calculate the horizontal percentage change from
(a) 2023 to 2024 and (b) 2024 to 2025. (c) Are the changes increases or decreases? (If amount and percentage are a
decrease show the numbers as negative, e.g. -55,000, -20% or (55,000), (20%). Round percentages to O decimal places, e.g. 12%.)
(a)
2023-2024
(b) 2024-2025 $
Amount
Percentage
%
%
Expert Solution
This question has been solved!
Explore an expertly crafted, step-by-step solution for a thorough understanding of key concepts.
This is a popular solution
Trending nowThis is a popular solution!
Step by stepSolved in 3 steps

Knowledge Booster
Learn more about
Need a deep-dive on the concept behind this application? Look no further. Learn more about this topic, accounting and related others by exploring similar questions and additional content below.Similar questions
- Antonio Company's net income and net sales are $50,000 and $800,000, respectively, and average total assets are $400,000. What is Antonio's return on assets?arrow_forwardFor the FY 2016, Alpha Company had net sales of $950,000 and a net income of $65,000, paid income taxes of $30,000, and had before-tax interest expense of $15,000. Use this information to determine the: 1. Times Interest Earned Ratio. 2. Profit Margin.arrow_forwardVishalarrow_forward
- Calculate the Current Ratio, Debt Ratio, Return on Assets (ROA) and Return on Equity (ROE). For the ROA and ROE, you should use the average total assets and the average total equity in your calculations. (The average is the total across two years divided by two). Calculate these values for each of 2011-2014. Interpret your calculations: what does this information mean? How is the company doing?arrow_forwardGive true answerarrow_forwardQ1) You are required to calculate the Relative Percentage Change in the company for the blanks below and the Net Profit for the other blanks. Show all working out below including the formula used for each year and include the completed table here. Year 2010 2011 2012 2013 2014 2015 2016 2017 2018 2019 Net Profit ($ 000’) <blank> 50 200 150 225 250 <blank> 200 250 260 Relative Percentage Change N/A -50% 300% <blank> 50% 11% -30% 14% 25% <blank> Table 1: Net Profit ($) per financial year Q1 a) Using Excel, create a column chart of the Net Profit calculated in part (a) for the years 2010-2019. label the axis and provide an appropriate title. Q1 b) Using Excel, create a Sparkline of the Relative Percentage Change calculated in part (a) for the years 2011-2019. use the Sparkline options to mark if there are any negative values and include a horizontal axis to easily visualise…arrow_forward
- Gross Profit for 2024 was $150,000 and for 2025 was \$200,000 . What is the percentage of increase or decrease in Gross Profit for the two periods?arrow_forwardFlounder Company has been operating for several years, and on December 31, 2017, presented the following balance sheet. FLOUNDER COMPANY BALANCE SHEET DECEMBER 31, 2017 Cash $20,900 Accounts payable $80,000 Receivables 117,000 Long-term notes payable 181,000 Inventory 75,000 Common stock (no par) 110,000 Plant assets (net) 354,000 Retained earnings 195,900 $566,900 $566,900 The net income for 2017 was $43,000. Assume that total assets are the same in 2016 and 2017.arrow_forward2. In 2022, williams sonoma reported sales of 6,783million, gross profits of 2,647million, EBIT of 949million, and net income of 681million. The company gross profit margin that year was closet to ................... (your answer should be in percentage).arrow_forward
- 2.The Moon Company had net income in 2022 of AED 40 million. Here are some of the financial ratios from the annual report. Return on Assets = 5% Debt Assets Ratio = 55% Profit Margin = 4.5% Inventory in days = 20 days Using these ratios, calculate the following for the Remal Company: a) Salesb) Total assetsc) Total asset turnover d) Total debte) Stockholders' equity f) Return on equityg) Inventoryarrow_forwardPlease help me with show all calculation thankuarrow_forwardVdarrow_forward
arrow_back_ios
SEE MORE QUESTIONS
arrow_forward_ios
Recommended textbooks for you

 AccountingAccountingISBN:9781337272094Author:WARREN, Carl S., Reeve, James M., Duchac, Jonathan E.Publisher:Cengage Learning,
 Accounting Information SystemsAccountingISBN:9781337619202Author:Hall, James A.Publisher:Cengage Learning,
 Horngren's Cost Accounting: A Managerial Emphasis...AccountingISBN:9780134475585Author:Srikant M. Datar, Madhav V. RajanPublisher:PEARSON
 Intermediate AccountingAccountingISBN:9781259722660Author:J. David Spiceland, Mark W. Nelson, Wayne M ThomasPublisher:McGraw-Hill Education
 Financial and Managerial AccountingAccountingISBN:9781259726705Author:John J Wild, Ken W. Shaw, Barbara Chiappetta Fundamental Accounting PrinciplesPublisher:McGraw-Hill Education


Accounting
Accounting
ISBN:9781337272094
Author:WARREN, Carl S., Reeve, James M., Duchac, Jonathan E.
Publisher:Cengage Learning,

Accounting Information Systems
Accounting
ISBN:9781337619202
Author:Hall, James A.
Publisher:Cengage Learning,

Horngren's Cost Accounting: A Managerial Emphasis...
Accounting
ISBN:9780134475585
Author:Srikant M. Datar, Madhav V. Rajan
Publisher:PEARSON

Intermediate Accounting
Accounting
ISBN:9781259722660
Author:J. David Spiceland, Mark W. Nelson, Wayne M Thomas
Publisher:McGraw-Hill Education

Financial and Managerial Accounting
Accounting
ISBN:9781259726705
Author:John J Wild, Ken W. Shaw, Barbara Chiappetta Fundamental Accounting Principles
Publisher:McGraw-Hill Education