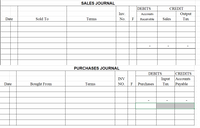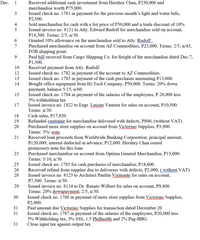
MAKE THE SJ AND PJ
|
Date |
Explanation |
Debit |
Credit |
| 2015 | |||
|
01-Dec |
Cash |
230,000 |
|
|
|
Merchandise inventory |
75,000 |
|
|
|
HC Capital |
|
305,000 |
|
03-Dec |
Accounts payable |
2,500 |
|
|
|
Bank |
|
2,500 |
|
04-Dec |
Cash |
30,240 |
|
|
|
Sales revenue |
|
27,000 |
|
|
Output VAT |
|
3,240 |
|
05-Dec |
|
20,720 |
|
|
|
Sales revenue |
|
18,500 |
|
|
Output VAT |
|
2,220 |
|
06-Dec |
Sales returns and allowances |
1,850 |
|
|
|
Output VAT |
222 |
|
|
|
Accounts receivable |
|
2,072 |
|
07-Dec |
Merchandise inventory |
25,000 |
|
|
|
Input VAT |
3,000 |
|
|
|
Accounts payable |
|
28,000 |
|
09-Dec |
Merchandise inventory |
1,300 |
|
|
|
Input VAT |
156 |
|
|
|
Cash |
|
1,456 |
|
10-Dec |
Cash |
20,350 |
|
|
|
Sales discount |
370 |
|
|
|
Accounts receivable |
|
20,720 |
|
12-Dec |
Accounts payable |
28,000 |
|
|
|
Merchandise inventory |
|
500 |
|
|
Bank |
|
27,500 |
|
13-Dec |
Merchandise inventory |
13,800 |
|
|
|
Input VAT |
1,656 |
|
|
|
Cash |
|
15,456 |
|
14-Dec |
Office equipment |
50,000 |
|
|
|
Cash |
|
10,000 |
|
|
Accounts payable |
|
40,000 |
|
15-Dec |
Salaries expense |
20,000 |
|
|
|
Bank |
|
19,000 |
|
|
Withholding tax payable |
|
1,000 |
|
17-Dec |
Accounts receivable |
11,760 |
|
|
|
Sales revenue |
|
10,500 |
|
|
Output VAT |
|
1,260 |
|
18-Dec |
Cash |
19,992 |
|
|
|
Sales revenue |
|
17,850 |
|
|
Output VAT |
|
2,142 |
|
19-Dec |
Sales returns and allowances |
800 |
|
|
|
Output VAT |
96 |
|
|
|
Cash |
|
896 |
|
20-Dec |
Store Supplies |
3900 |
|
|
|
Input VAT |
468 |
|
|
|
Accounts Payable |
|
4368 |
|
21-Dec |
Bank |
108000 |
|
|
|
Interest |
12000 |
|
|
|
Note payable |
|
120000 |
|
23-Dec |
Merchandise Inventory |
15000 |
|
|
|
Input Vat |
1800 |
|
|
|
Accounts Payable |
|
16800 |
|
25-Dec |
Merchandise Inventory |
18600 |
|
|
|
Input Vat |
2232 |
|
|
|
Cash |
|
20832 |
|
26-Dec |
Cash |
2240 |
|
|
|
Purchase Return |
|
2000 |
|
|
Input VAT |
|
240 |
|
28-Dec |
Accounts Receivable |
8400 |
|
|
|
Sales Revenue |
|
7500 |
|
|
Output VAT |
|
900 |
|
29-Dec |
Accounts Receivable |
8780.8 |
|
|
|
Cash |
2195.2 |
|
|
|
Sales Revenue |
|
9800 |
|
|
Output VAT |
|
1176 |
|
30-Dec |
Store Supplies |
2000 |
|
|
|
Input VAT |
100 |
|
|
|
Bank |
|
2100 |
|
31-Dec |
Accounts Payable |
4368 |
|
|
|
Discount received |
195 |
|
|
|
Bank |
|
4173 |
|
31-Dec |
Salaries expense |
20,000 |
|
|
|
Bank |
|
17,700 |
|
|
Withholding tax payable |
|
1,000 |
|
|
SSS |
|
600 |
|
|
Phil health |
|
300 |
|
|
Pag-IBIG |
|
400 |
|
31-Dec |
Output VAT |
10620 |
|
|
|
Input VAT |
|
9172 |
|
|
VAT Payable |
|
1448 |


Step by stepSolved in 2 steps with 2 images

- Dogarrow_forwardAssets Cash Accounts receivable Inventory Year 2 $ 4,000 15,000 35,000 Assuming that net credit sales for Year 2 totaled $270,000, what is the company's most recent accounts receivable turnover? Multiple Choice 20 times 18 times 7.7 times 22.5 times Year 1 $2,000 12,000 $ 38,000 Help Save & Exit Submitarrow_forwardsh16 Abbey Co. sold merchandise to Gomez Co. on account, $34,000, terms 2/15, n/45. The cost of the goods sold was $14,693. Abbey Co. issued a credit memo for $4,100 for merchandise returned that originally cost $1,189. What is the amount of gross profit earned by Abbey Co. on these transactions? a.$13,504 b.$19,816 c.$16,396 d.$4,100arrow_forward
- work Assignment Cola Inc. and Soda Co. are two of the largest and most successful beverage companies in the world in terms of sell and their receivables management practices. To evaluate their ability to collect on credit sales, consider the amounts reported in their annual reports (amounts in millions). Soda Co. Cola Inc. 2015 2014 2013 2015 2014 2013 $61,938 $47,432 $47,251 4,794 98 Fiscal Year Ended: $39,319 $35,190 $35,944 3,893 Net Sales 3,864 4,578 3,221 6,547 Accounts Receivable Allowance for Doubtful Accounts Accounts Receivable, Net of Allowance 56 63 59 152 78 4,522 3,830 3,162 6,395 4,696 3,786 Required: 1. Calculate the receivables turnover ratios and days to collect for Cola Inc. and Soda Co. for 2015 and 2014. (Use Do not round intermediate calculations on Accounts Receivable Turnover Ratio. Round your final answers t Use final rounded answers from Accounts Receivable Turnover Ratio for Days to Collect ratio calculation.) 2015 2014 Cola Inc. Soda Co. Cola Inc. Soda Co.…arrow_forwardpre.3arrow_forwardA manufacturer reports the data below. Accounts payable Accounts receivable Inventory Net sales $ 9,649 18,474 5,455 233,607 Cost of goods sold 138,200 (1) Compute the number of days in the cash conversion cycle. (2) Is the company more efficient at managing cash than its competitor who has a cash conversion cycle of 14 days? Complete this question by entering your answers in the tabs below. Required 1 Required 2 Compute the number of days in the cash conversion cycle. Note: Use 365 days in a year. Round calculations to the nearest whole day. Cash conversion cycle daysarrow_forward
- 2.17) Find the average daily balance (new purchases included) Payment End of Day Balance Dates 12/1-12/9 12/10 12/11-12/17 12/18 12/19-12/31 Average $840.00 Purchase $230.00 X Number of Days $975.00 x $1,205.00 x $1,205.00 x $365.00 X $365.00 x Total → 9 1 7 1 13. 31 Sum of Balancesarrow_forwardA-8arrow_forwardE6-2 Reporting Net Sales with Credit Sales, Sales Discounts, and Credit Card Sales LO6-1 The following transactions were selected from the records of Ocean View Company: July 12 Sold merchandise to Customer R, who charged the $3,000 purchase on his Visa credit card. Visa charges OceanView a 2 percent credit card fee. 15 Sold merchandise to Customer S at an invoice price of $9,000; terms 3/10, n/30. 20 Sold merchandise to Customer T at an invoice price of $4,000; terms 3/10, n/30. 23 Collected payment from Customer S from July 15 sale. Aug. 25 Collected payment from Customer T from July 20 sale. Required: Assuming that Sales Discounts and Credit Card Discounts are treated as contra-revenues, compute net sales for the two months ended August 31.arrow_forward
- KINDLY CHECK IF THERE ARE INCORRECT OR WRONG ENTRIESarrow_forwardExercise 5-18 (Algo) Calculate receivables ratios (LO5-8) Below are amounts (in millions) from three companies' annual reports. WalCo TarMart CostGet Required: Beginning Accounts Receivable $1,775 5,966 589 Ending Accounts Receivable $2,722 6,494 625 Net Sales $318,427 63,878 64,963 1. Calculate the receivables turnover ratio and the average collection period for WalCo, TarMart and CostGet. 2. Which company appears most efficient in collecting cash from sales? Complete this question by entering your answers in the tabs below. Required 1 Required 2 Calculate the receivables turnover ratio and the average collection period for WalCo, TarMart and CostGet. (Enter your answers in millions rounded to 1 decimal place.) WalCo TarMart CostGet WalCo TarMart CostGet Choose Numerator Receivables Turnover Ratio Choose Denominator Receivables turnover ratio times times times Average Collection Period Choose Numerator Choose Denominator Average collection period days days daysarrow_forwardhsd.3arrow_forward

 AccountingAccountingISBN:9781337272094Author:WARREN, Carl S., Reeve, James M., Duchac, Jonathan E.Publisher:Cengage Learning,
 Accounting Information SystemsAccountingISBN:9781337619202Author:Hall, James A.Publisher:Cengage Learning,
 Horngren's Cost Accounting: A Managerial Emphasis...AccountingISBN:9780134475585Author:Srikant M. Datar, Madhav V. RajanPublisher:PEARSON
 Intermediate AccountingAccountingISBN:9781259722660Author:J. David Spiceland, Mark W. Nelson, Wayne M ThomasPublisher:McGraw-Hill Education
 Financial and Managerial AccountingAccountingISBN:9781259726705Author:John J Wild, Ken W. Shaw, Barbara Chiappetta Fundamental Accounting PrinciplesPublisher:McGraw-Hill Education


