Applications and Investigations in Earth Science (9th Edition)
9th Edition
ISBN: 9780134746241
Author: Edward J. Tarbuck, Frederick K. Lutgens, Dennis G. Tasa
Publisher: PEARSON
expand_more
expand_more
format_list_bulleted
Question

Transcribed Image Text:5
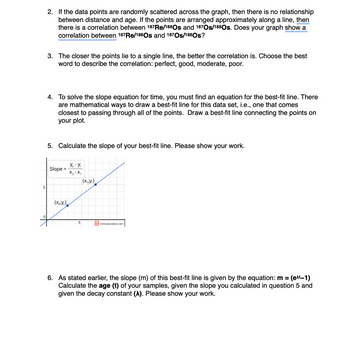
2. If the data points are randomly scattered across the graph, then there is no relationship
between distance and age. If the points are arranged approximately along a line, then
there is a correlation between 187 Re/188 Os and 1870s/1880s. Does your graph show a
correlation between 187 Re/188 Os and 187Os/188Os?
3. The closer the points lie to a single line, the better the correlation is. Choose the best
word to describe the correlation: perfect, good, moderate, poor.
4. To solve the slope equation for time, you must find an equation for the best-fit line. There
are mathematical ways to draw a best-fit line for this data set, i.e., one that comes
closest to passing through all of the points. Draw a best-fit line connecting the points on
your plot.
5. Calculate the slope of your best-fit line. Please show your work.
Slope =
Y₂- Y₁
X₂- X₁
(x₁y₁)
(X21Y2)
5
inchcalculator.com
6. As stated earlier, the slope (m) of this best-fit line is given by the equation: m =
Calculate the age (t) of your samples, given the slope you calculated in question 5 and
given the decay constant (^). Please show your work.
(ext-1)

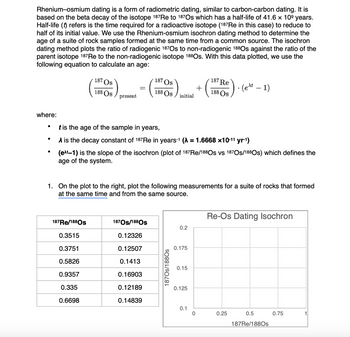
Transcribed Image Text:Rhenium-osmium dating is a form of radiometric dating, similar to carbon-carbon dating. It is
based on the beta decay of the isotope 187 Re to 187Os which has a half-life of 41.6 × 10⁹ years.
Half-life (t) refers is the time required for a radioactive isotope (187Re in this case) to reduce to
half of its initial value. We use the Rhenium-osmium isochron dating method to determine the
age of a suite of rock samples formed at the same time from a common source. The isochron
dating method plots the ratio of radiogenic 187 Os to non-radiogenic 188Os against the ratio of the
parent isotope 187 Re to the non-radiogenic isotope 1880s. With this data plotted, we use the
following equation to calculate an age:
where:
187 Os
187 Re
⋅ (ext — 1).
-
187 Os
188 Os
+
=
188 Os
188 Os initial
present
•
It is the age of the sample in years,
•
•
▲ is the decay constant of 187 Re in years-1 (λ = 1.6668 ×10⁻¹¹ yr-1)
(ext-1) is the slope of the isochron (plot of 187 Re/188Os vs 1870s/188Os) which defines the
age of the system.
1. On the plot to the right, plot the following measurements for a suite of rocks that formed
at the same time and from the same source.
Re-Os Dating Isochron
187 Re/1880s
1870s/188Os
0.2
0.3515
0.12326
0.3751
0.12507
0.175
0.5826
0.1413
0.9357
0.16903
1870s/1880s
0.15
0.335
0.12189
0.125
0.6698
0.14839
0.1
0
0.25
0.5
0.75
1
187Re/1880s
Expert Solution
This question has been solved!
Explore an expertly crafted, step-by-step solution for a thorough understanding of key concepts.
This is a popular solution
Trending nowThis is a popular solution!
Step by stepSolved in 2 steps

Knowledge Booster
Recommended textbooks for you
 Applications and Investigations in Earth Science ...Earth ScienceISBN:9780134746241Author:Edward J. Tarbuck, Frederick K. Lutgens, Dennis G. TasaPublisher:PEARSON
 Exercises for Weather & Climate (9th Edition)Earth ScienceISBN:9780134041360Author:Greg CarbonePublisher:PEARSON
 Environmental ScienceEarth ScienceISBN:9781260153125Author:William P Cunningham Prof., Mary Ann Cunningham ProfessorPublisher:McGraw-Hill Education
 Earth Science (15th Edition)Earth ScienceISBN:9780134543536Author:Edward J. Tarbuck, Frederick K. Lutgens, Dennis G. TasaPublisher:PEARSON
 Environmental Science (MindTap Course List)Earth ScienceISBN:9781337569613Author:G. Tyler Miller, Scott SpoolmanPublisher:Cengage Learning
 Physical GeologyEarth ScienceISBN:9781259916823Author:Plummer, Charles C., CARLSON, Diane H., Hammersley, LisaPublisher:Mcgraw-hill Education,

Applications and Investigations in Earth Science ...
Earth Science
ISBN:9780134746241
Author:Edward J. Tarbuck, Frederick K. Lutgens, Dennis G. Tasa
Publisher:PEARSON

Exercises for Weather & Climate (9th Edition)
Earth Science
ISBN:9780134041360
Author:Greg Carbone
Publisher:PEARSON

Environmental Science
Earth Science
ISBN:9781260153125
Author:William P Cunningham Prof., Mary Ann Cunningham Professor
Publisher:McGraw-Hill Education

Earth Science (15th Edition)
Earth Science
ISBN:9780134543536
Author:Edward J. Tarbuck, Frederick K. Lutgens, Dennis G. Tasa
Publisher:PEARSON

Environmental Science (MindTap Course List)
Earth Science
ISBN:9781337569613
Author:G. Tyler Miller, Scott Spoolman
Publisher:Cengage Learning

Physical Geology
Earth Science
ISBN:9781259916823
Author:Plummer, Charles C., CARLSON, Diane H., Hammersley, Lisa
Publisher:Mcgraw-hill Education,