
MATLAB: An Introduction with Applications
6th Edition
ISBN: 9781119256830
Author: Amos Gilat
Publisher: John Wiley & Sons Inc
expand_more
expand_more
format_list_bulleted
Related questions
Question
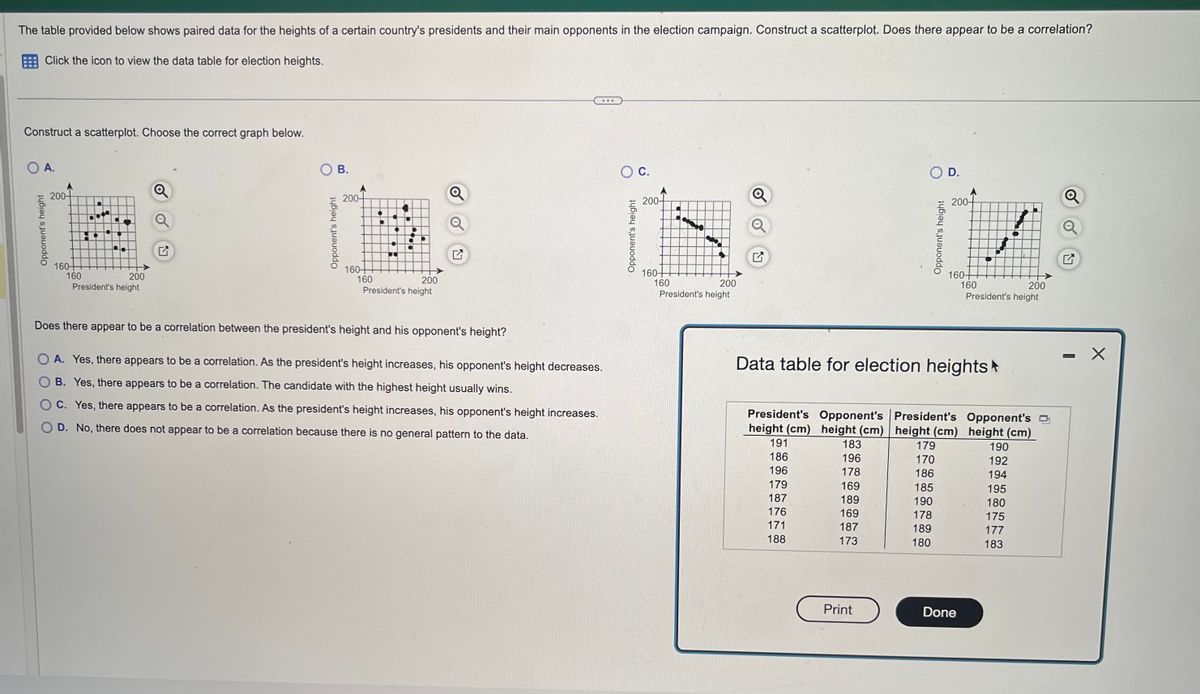

Transcribed Image Text:The table provided below shows paired data for the heights of a certain country's presidents and their main opponents in the election campaign. Construct a scatterplot. Does there appear to be a correlation?
Click the icon to view the data table for election heights.
Construct a scatterplot. Choose the correct graph below.
O A.
Opponent's height
200-
160-
160
200
President's height
27
B.
Opponent's height
200-
160-
160
200
President's height
L
Does there appear to be a correlation between the president's height and his opponent's height?
OA. Yes, there appears to be a correlation. As the president's height increases, his opponent's height decreases.
OB. Yes, there appears to be a correlation. The candidate with the highest height usually wins.
C. Yes, there appears to be a correlation. As the president's height increases, his opponent's height increases.
D. No, there does not appear to be a correlation because there is no general pattern to the data.
Opponent's height
C.
200-
160+
200
President's height
160
191
186
196
179
187
176
171
188
183
196
178
OD.
169
189
169
187
173
Print
Opponent's height
Data table for election heights
200-
President's Opponent's President's Opponent's
height (cm) height (cm) height (cm) height (cm)
179
170
186
185
190
178
189
180
160+
200
President's height
160
Done
190
192
194
195
180
175
177
183
Q
X
Expert Solution
This question has been solved!
Explore an expertly crafted, step-by-step solution for a thorough understanding of key concepts.

This is a popular solution

Trending nowThis is a popular solution!

Step by stepSolved in 3 steps with 2 images

Knowledge Booster

Similar questions
- A small organic chemistry class just took their midterm. The scores of the eight students are listed below. 65, 73, 78, 85, 87, 69, 90, 32 What type of graph could you use to represent this data? A. histogram B. bar chart C. pie chart D. stem and leaf E. All of the above O F. A and D only G. B and C only Click to select your answer. O Oarrow_forwardC learn.vccs.edu/courses/474823/assignments/9794759 Identify if the following correlation. Describe if it is strong, weak, or no correlation. Then determine if the relationship is positive, negative, or neither. Explain your answer. O ● OHO ● ● ● ● O acer Provide your answer in the box below.arrow_forwardSelect the graph that shows the scatterplot of the data set. Y 4 1 -5 -3 1 - 5 - 1 1 7 - 5arrow_forward
- The ages (in years) and helghts (in inches) of all pitchers for a beseball team are listed. Find the coefficient of variation for each of the two data sets. Then compare the results. -Click the Icon to view the data sets. CV. %D Round to one decimal place as needed.)arrow_forwardThe heights and weights of a set of students were recorded on a scatter graph. Describe the correlation depicted below: Select- strong, moderate, weak and Select- positive, negativearrow_forwardThe graph below is a scatter plot between liabilities and assets, bothexpressed in millions. i. Critically assess this scatter plot explaining about the relationship betweentwo variables.ii. A researcher claims that the correlation is showing that changes in assetscause changes in liabilities. Is he right or wrong? Explain your answer.arrow_forward
- Use a graphing calculator to find the equation of the line of best fit for the data in the table below. Find the value of the correlation coefficient r. Then predict the number of movie tickets sold in 2014.arrow_forwardA scatterplot of two variables is a picture of the relationship represented in a correlation. Group of answer choices True Falsearrow_forwardConstruct a scatter plot from the given points and describe the correlation.arrow_forward
- The ages (in years) and heights (in inches) of all pitchers for a baseball team are listed. Find the coefficient of variation for each of the two data sets. Then compare the results. heights Ages 73 28 76 22 74 23 72 24 77 24 78 27 76 31 79 28 73 27 78 35 74 33 79 36arrow_forwarda teacher asked her students how many hours of sleep they had the night before a test. what type of correlation does your graph show? Determine a equation line of best fit BY HAND using the points 7,90 nd 6,76. hours slept : 8 7 7 8 6 5 7 4 9 7 score 83 86 74 88 76 63 90 60 89 81arrow_forwardThe table shows total earnings, y (in dollars ), of a food x,0,1,2,3,4,5,6 y,0,18,40,62,77,85,113 a. Make a scatter plot. b. What type of correlation is shown in the graarrow_forward
arrow_back_ios
SEE MORE QUESTIONS
arrow_forward_ios
Recommended textbooks for you
- MATLAB: An Introduction with ApplicationsStatisticsISBN:9781119256830Author:Amos GilatPublisher:John Wiley & Sons Inc
 Probability and Statistics for Engineering and th...StatisticsISBN:9781305251809Author:Jay L. DevorePublisher:Cengage Learning
 Statistics for The Behavioral Sciences (MindTap C...StatisticsISBN:9781305504912Author:Frederick J Gravetter, Larry B. WallnauPublisher:Cengage Learning
  Elementary Statistics: Picturing the World (7th E...StatisticsISBN:9780134683416Author:Ron Larson, Betsy FarberPublisher:PEARSON
 The Basic Practice of StatisticsStatisticsISBN:9781319042578Author:David S. Moore, William I. Notz, Michael A. FlignerPublisher:W. H. Freeman
 Introduction to the Practice of StatisticsStatisticsISBN:9781319013387Author:David S. Moore, George P. McCabe, Bruce A. CraigPublisher:W. H. Freeman
MATLAB: An Introduction with Applications
Statistics
ISBN:9781119256830
Author:Amos Gilat
Publisher:John Wiley & Sons Inc
Probability and Statistics for Engineering and th...
Statistics
ISBN:9781305251809
Author:Jay L. Devore
Publisher:Cengage Learning
Statistics for The Behavioral Sciences (MindTap C...
Statistics
ISBN:9781305504912
Author:Frederick J Gravetter, Larry B. Wallnau
Publisher:Cengage Learning
Elementary Statistics: Picturing the World (7th E...
Statistics
ISBN:9780134683416
Author:Ron Larson, Betsy Farber
Publisher:PEARSON
The Basic Practice of Statistics
Statistics
ISBN:9781319042578
Author:David S. Moore, William I. Notz, Michael A. Fligner
Publisher:W. H. Freeman
Introduction to the Practice of Statistics
Statistics
ISBN:9781319013387
Author:David S. Moore, George P. McCabe, Bruce A. Craig
Publisher:W. H. Freeman