
MATLAB: An Introduction with Applications
6th Edition
ISBN: 9781119256830
Author: Amos Gilat
Publisher: John Wiley & Sons Inc
expand_more
expand_more
format_list_bulleted
Related questions
Concept explainers
Question
thumb_up100%
Refer to the accompanying data set of
A. Construct a 95% confidence interval of the mean drive-through service times at dinner for Restaurant X.
____<μ<___sec
B. Construct a 95% confidence interval of the mean drive-through service times at dinner for Restaurant Y.
____<μ<___sec
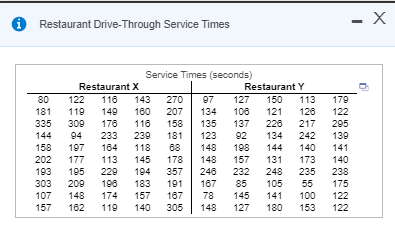

Transcribed Image Text:Restaurant Drive-Through Service Times
Service Times (seconds)
Restaurant X
122 110
110
Restaurant Y
80
181
335
144 04
158
202
103
303
107
157
143
180
118
233 230
118
145
104
183
157
140
270
207
158
181
68
178
357
101
187
305
97
134
135
123
148
148
248 232 248 235 238
187
78
148
127 150
108
137
02
108
157
113
128
217
242
140
173
170
122
205
130
140
121
220
134
300
176
184
177 113
195 220
200
107
144
141
131
140
108
148
162
85
145
127
105
141
180
55
100
153
175
122
122
174
110
Expert Solution
This question has been solved!
Explore an expertly crafted, step-by-step solution for a thorough understanding of key concepts.

This is a popular solution

Trending nowThis is a popular solution!

Step by stepSolved in 6 steps with 7 images

Knowledge Booster


Learn more about
Need a deep-dive on the concept behind this application? Look no further. Learn more about this topic, statistics and related others by exploring similar questions and additional content below.Similar questions
- A study was done of 6 patients admitted to a hospital. Their ages (x) and systolic blood pressure (y) was recorded. Systolic blood pressure (y) Age (x) 43 123 48 125 56 135 61 143 67 145 70 152 Determine the equation of the regression equation, reporting each to 3 decimal places. A. Slope is B. Y intercept is C. Compute the residual for x = 43, using the rounded slope and y intercept. Report answer to 3 decimal places.arrow_forwardWhat percentage of hospitals provide at least some charity care? Based on a random sample of 10 hospital reports from eastern states, the sample mean was x = 62.3 % and the sample standard deviation was s = 8.0 %. a. Find a 98% confidence interval for the population average µ of the percentage of hospitals providing at least some charity care. b. Interpretation. What does the confidence interval mean in the context of this problem?arrow_forwardRefer to the accompanying data set and construct a 90% confidence interval estimate of the mean pulse rate of adult females; then do the same for adult males. Compare the results. Click the icon to view the pulse rates for adult females and adult males. Construct a 90% confidence interval of the mean pulse rate for adult females. | bpm<µ<| bpm (Round to one decimal place as needed.) Construct a 90% confidence interval of the mean pulse rate for adult males. |bpm<μ< bpm (Round to one decimal place as needed.) Compare the results. A. The confidence intervals overlap, so it appears that there is no difference in mean pulse rates between adult females and adult males. B. The confidence intervals do not overlap, so it appears that adult females have a higher mean pulse rate than adult males. C. The confidence intervals overlap, so it appears that adult males have a higher mean pulse rate than adult females. D. The confidence intervals do not overlap, so it appears that there is no…arrow_forward
- Refer to the accompanying data set and construct a 95%confidence interval estimate of the mean pulse rate of adult females; then do the same for adult males. Compare the results. . 1. Construct a 95%confidence interval of the mean pulse rate for adult females. ____ bpm<μ<____ bpm (Round to one decimal place as needed.) 2. Construct a 95% confidence interval of the mean pulse rate for adult males. _____ bpm<μ<____ bpm (Round to one decimal place as needed.)arrow_forwardImport the data from the Hill City Excel file into Minitab.You are trying to predict Price.Note: Mtn View=1 if there is a mountain view, 0 otherwise. The rest of the variables should be self explanatory. 1.Perform an F Test for overall significance of the model 2.Perform a T test for slope for the age variable 3. Find a 95% confidence interval for the slope of the SqFeet variable4. Create a prediction, CI, and PI for 1 new set of x values (any valid numbers you want), and interpret each.5. Run the residual plots and indicate if they show any problems with the model.arrow_forward## In a survey of adults with diabetes, the average body mass index (BMI) in a sample of 1938 women was 32.2 with a standard deviation of 0.03. The BMI in a sample of 1555 men was 30.4, with a standard deviation of 0.06. Construct a 92% confidence interval for the difference in the mean BMI between women and men with diabetes, INTERPRET THE RESULTS. DOES THE CONFIDENCE INTERVAL CONTRADICT THE CLAIM THAT THE MEAN BMI IS THE SAME FOR BOTH MEN AND WOMEN WITH DIABETES?arrow_forward
- Refer to the accompanying data set and construct a 95% confidence interval estimate of the mean pulse rate of adult females; then do the same for adult males. Compare the results. Click the icon to view the pulse rates for adult females and adult males. Construct a 95% confidence interval of the mean pulse rate for adult females. bpm<μ< bpm (Round to one decimal place as needed.) Construct a 95% confidence interval of the mean pulse rate for adult males. bpm <μ< bpm (Round to one decimal place as needed.) Compare the results. OA. The confidence intervals overlap, so it appears that adult males have a higher mean pu OB. The confidence intervals do not overlap, so it appears that adult females have a higher OC. The confidence intervals overlap, so it appears that there is no difference in mean pulse O D. The confidence intervals do not overlap, so it appears that there is no difference in mea Pulse Rates 84 73 47 62 52 61 54 78 49 60 70 57 65 78 84 67 64 97 40 85 Pulse Rates (beats per…arrow_forwardView both photos attached and answer the question below. Estimate the net sale in future promotions, 95% confidence intervals for the population means were constructed. See output below. Explain and compare the confidence interval for net sales for Promotional and Regular customers. Make sure to clearly describe the confidence intervals in the context of the problem.arrow_forwardPulse Rates (beats per minute) Males Females 85 74 81 86 75 62 95 80 48 75 56 73 63 73 69 75 50 86 89 87 54 54 61 65 81 51 77 55 77 81 87 91 51 72 87 90 63 63 57 93 74 64 38 68 58 96 64 90 66 55 86 79 76 67 74 81 82 58 78 74 67 59 65 57 66 65 66 97 96 69 78 73 44 86 62 78 86 58 64 76arrow_forward
arrow_back_ios
arrow_forward_ios
Recommended textbooks for you
- MATLAB: An Introduction with ApplicationsStatisticsISBN:9781119256830Author:Amos GilatPublisher:John Wiley & Sons Inc
 Probability and Statistics for Engineering and th...StatisticsISBN:9781305251809Author:Jay L. DevorePublisher:Cengage Learning
 Statistics for The Behavioral Sciences (MindTap C...StatisticsISBN:9781305504912Author:Frederick J Gravetter, Larry B. WallnauPublisher:Cengage Learning
  Elementary Statistics: Picturing the World (7th E...StatisticsISBN:9780134683416Author:Ron Larson, Betsy FarberPublisher:PEARSON
 The Basic Practice of StatisticsStatisticsISBN:9781319042578Author:David S. Moore, William I. Notz, Michael A. FlignerPublisher:W. H. Freeman
 Introduction to the Practice of StatisticsStatisticsISBN:9781319013387Author:David S. Moore, George P. McCabe, Bruce A. CraigPublisher:W. H. Freeman
MATLAB: An Introduction with Applications
Statistics
ISBN:9781119256830
Author:Amos Gilat
Publisher:John Wiley & Sons Inc
Probability and Statistics for Engineering and th...
Statistics
ISBN:9781305251809
Author:Jay L. Devore
Publisher:Cengage Learning
Statistics for The Behavioral Sciences (MindTap C...
Statistics
ISBN:9781305504912
Author:Frederick J Gravetter, Larry B. Wallnau
Publisher:Cengage Learning
Elementary Statistics: Picturing the World (7th E...
Statistics
ISBN:9780134683416
Author:Ron Larson, Betsy Farber
Publisher:PEARSON
The Basic Practice of Statistics
Statistics
ISBN:9781319042578
Author:David S. Moore, William I. Notz, Michael A. Fligner
Publisher:W. H. Freeman
Introduction to the Practice of Statistics
Statistics
ISBN:9781319013387
Author:David S. Moore, George P. McCabe, Bruce A. Craig
Publisher:W. H. Freeman